Introduction for MHA


The development of single-cell RNA (scRNA-seq) and spatial transcriptome sequencing (stRNA-seq) technologies has enabled the study of tissue and organ microenvironment heterogeneity at the molecular level and single-cell scale. Currently, scRNA data for nearly all human tissues and organs, as well as model animals (mice), have been published. However, in-depth analysis of these data often requires a foundation in bioinformatics, and the complex computational processes involved can hinder researchers from quickly retrieving the needed information. Moreover, some comprehensive scRNA databases do not specifically focus on the male genitourinary system and may suffer from issues such as irregular disease classification and cell clustering. To address these challenges, we present MHA, an online visual interactive website that provides scRNA and stRNA data for various tissues and organs of the male genitourinary system under both physiological and pathological conditions.

Overview for MHA


We focus on scRNA data related to the development and disease of the male genitourinary system. In the current version, MHA includes 12 datasets spanning 3 species (Homo sapiens, Rattus norvegicus, and Mus musculus) and 5 organs/tissues (Testis, Epididymis, Vas deferens, Corpus cavernosum, and Prostate), totaling 474,486 scRNA data points. Additionally, MHA provides two stRNA datasets for human and rat corpus cavernosum. For data visualization, we offer various output options, including UMAP and TSNE plots, violin plots, frequency bar plots, and bubble plots, to meet the diverse display needs of users.

scRNA datasets:

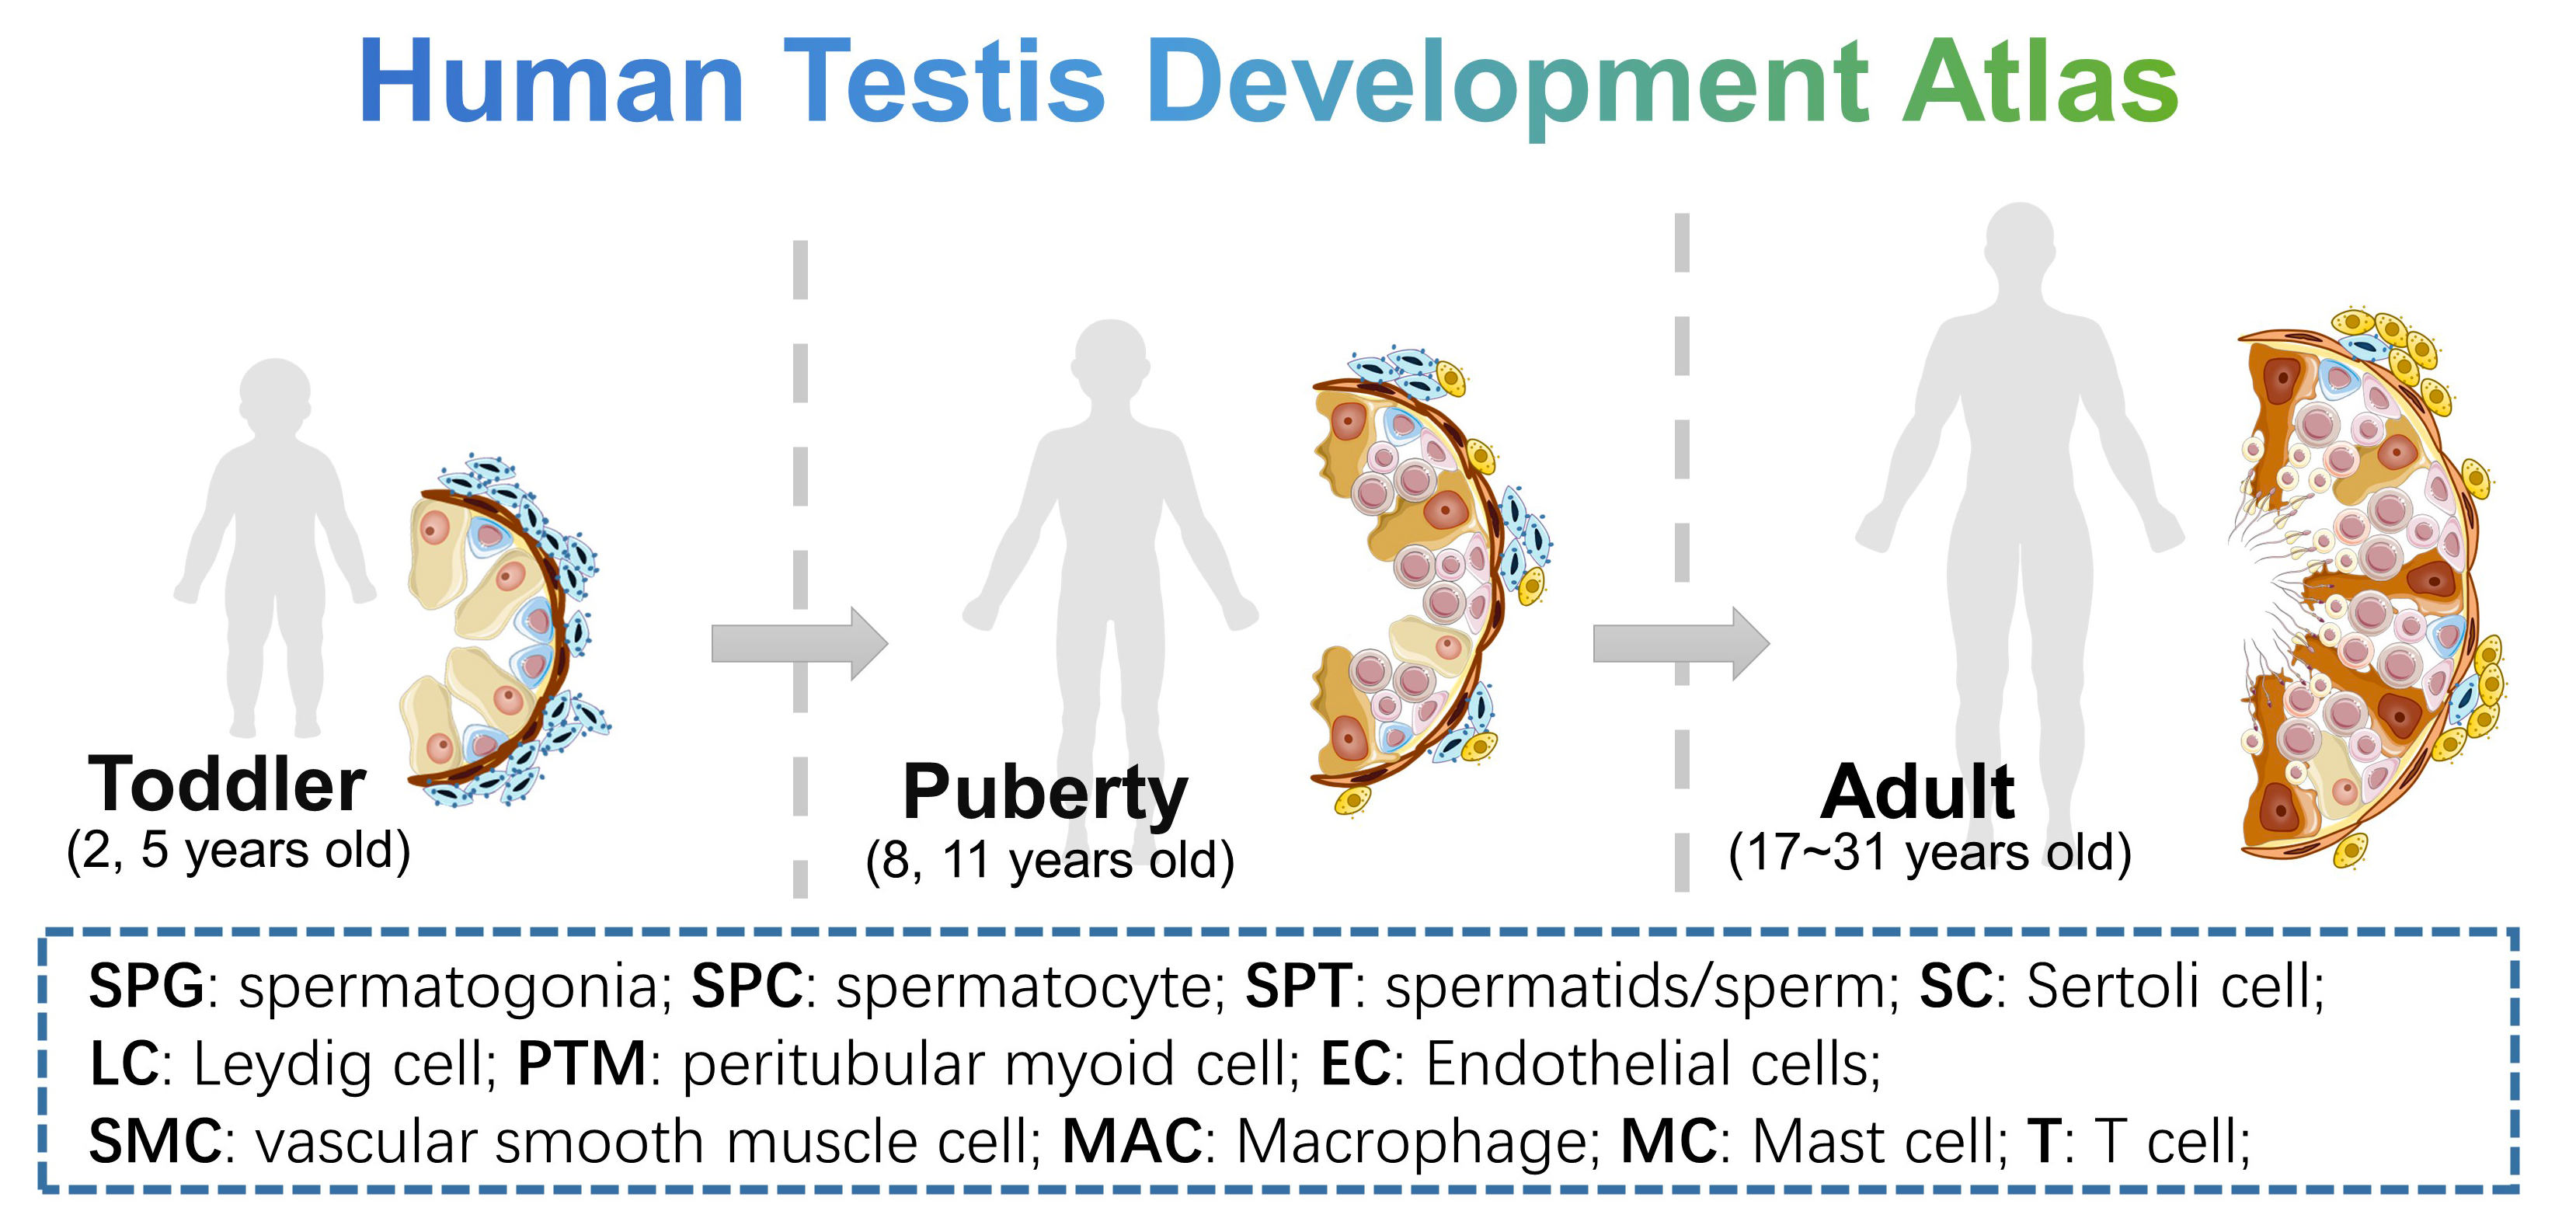
  • Human Testis Development Atlas: 10 human testicular samples include 2 yo (n=1), 5 yo (n=1), 8 yo (n=1), 11 yo (n=1), 17 yo (n=1) and adults (n=5), to show the normal development process of human testis. Data could be downloaded from GSE149512 of GEO data base.
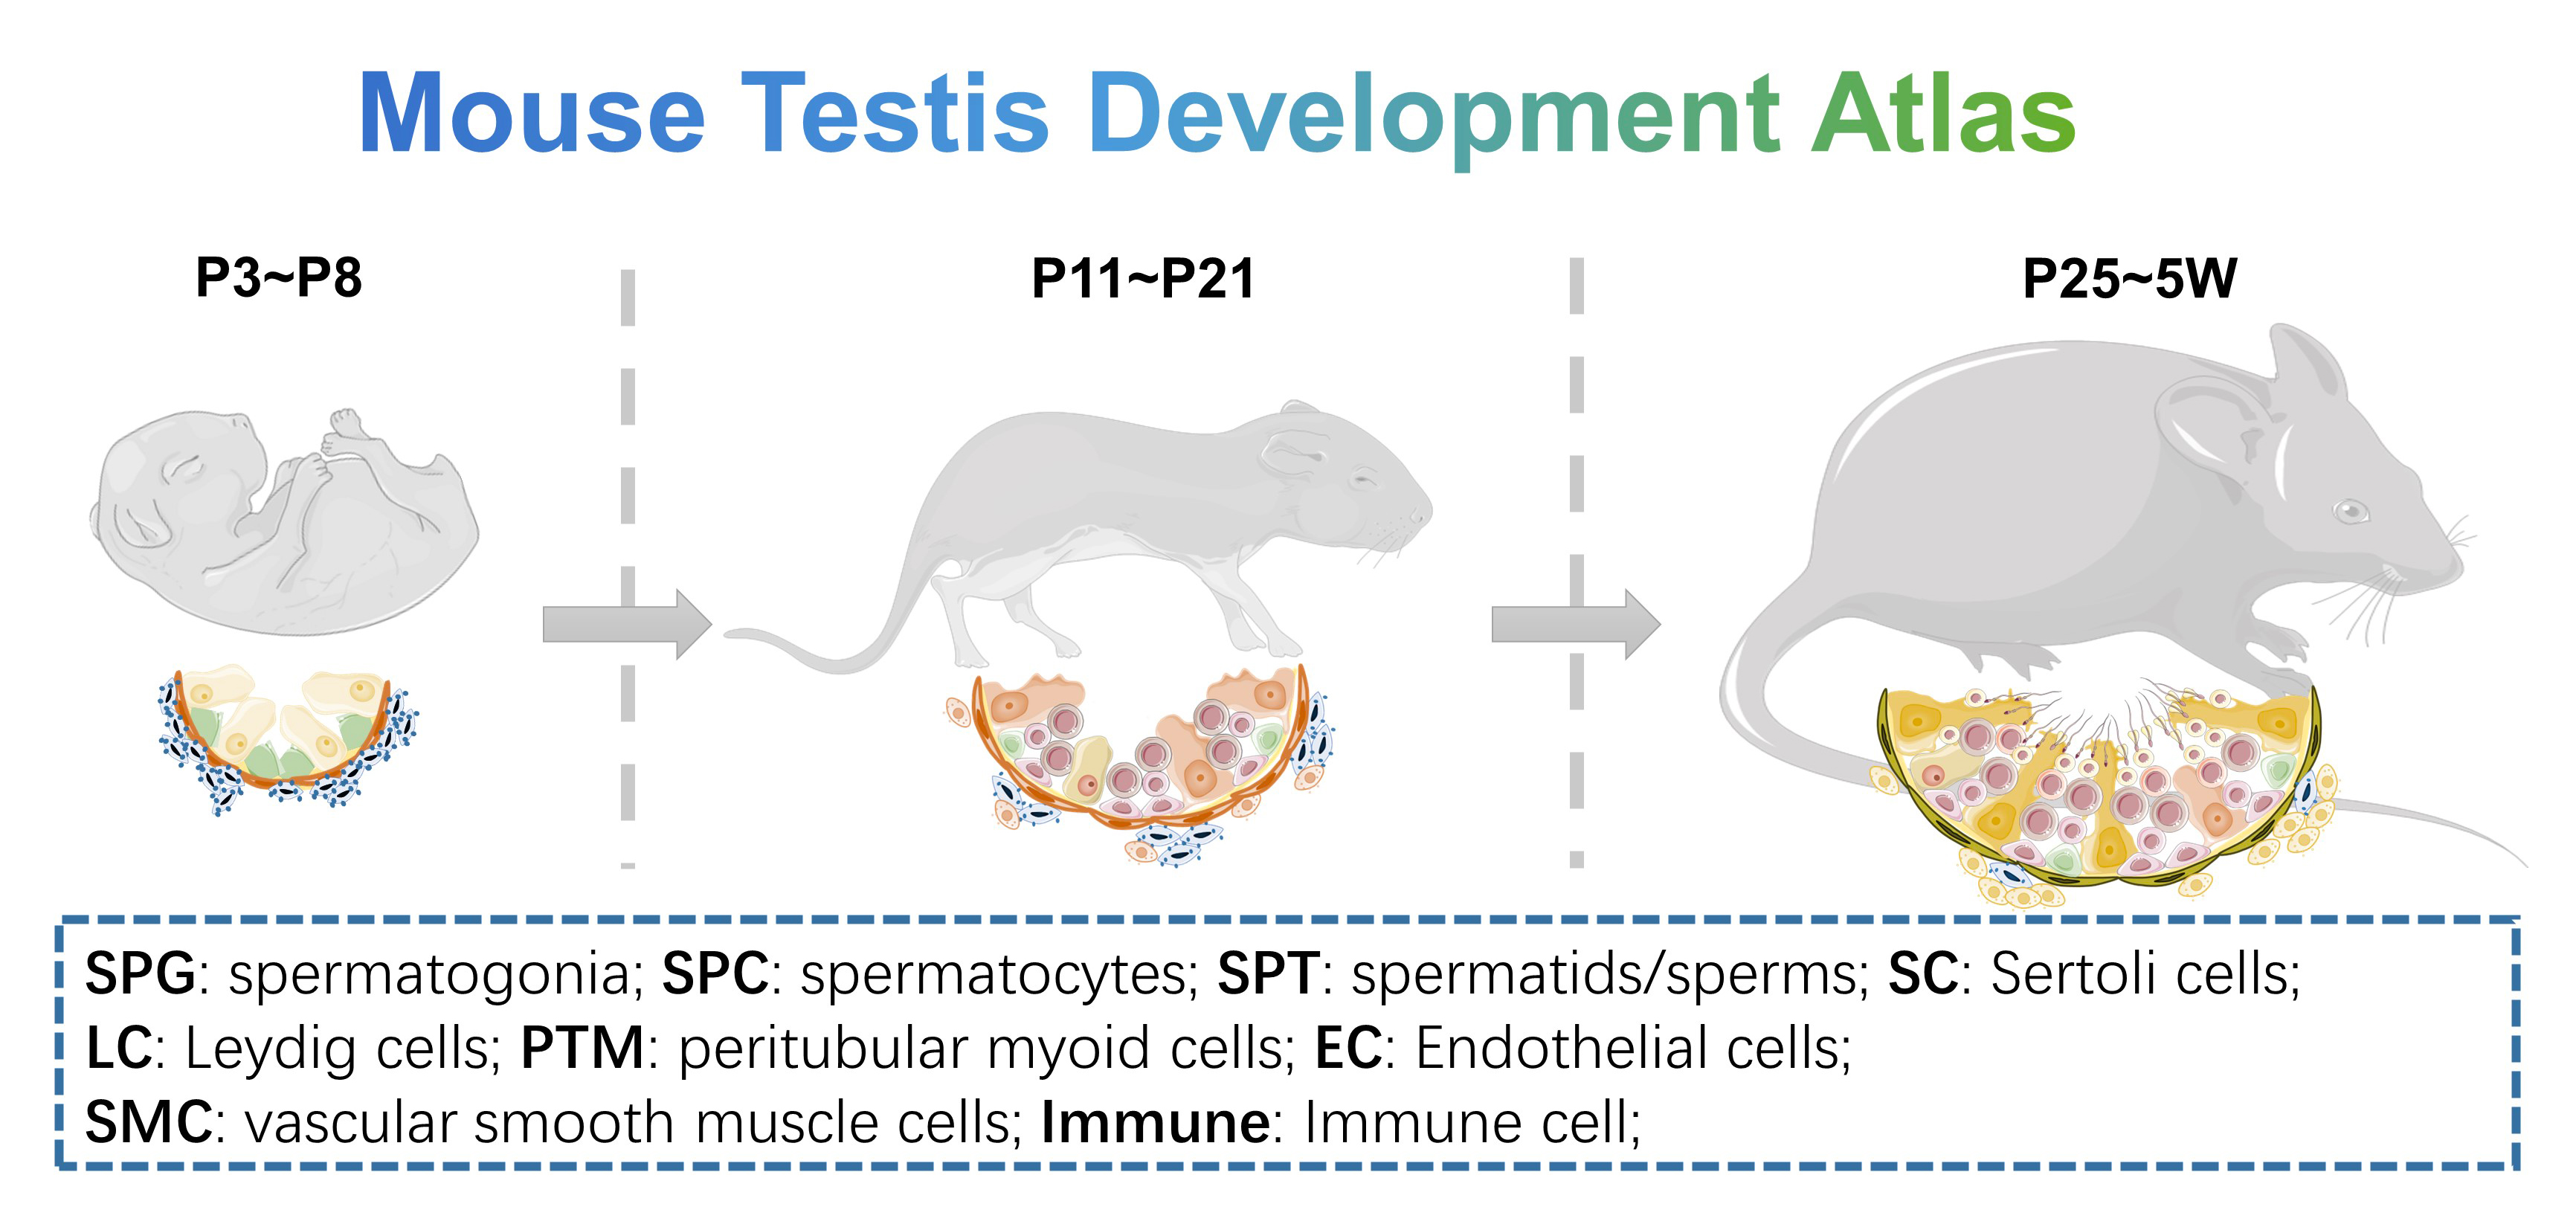
  • Mouse Testis Development Atlas: 9 C57-mice testicular samples include 3 days (n=1), 6 days (n=1), 8 days (n=1), 11 days (n=1), 14 days (n=1), 17 days (n=1), 21 days (n=1), 25 days (n=1) and 5 weeks (n=1), to show the normal development process of mouse testis. Data could be downloaded from GSE211115 of GEO data base.
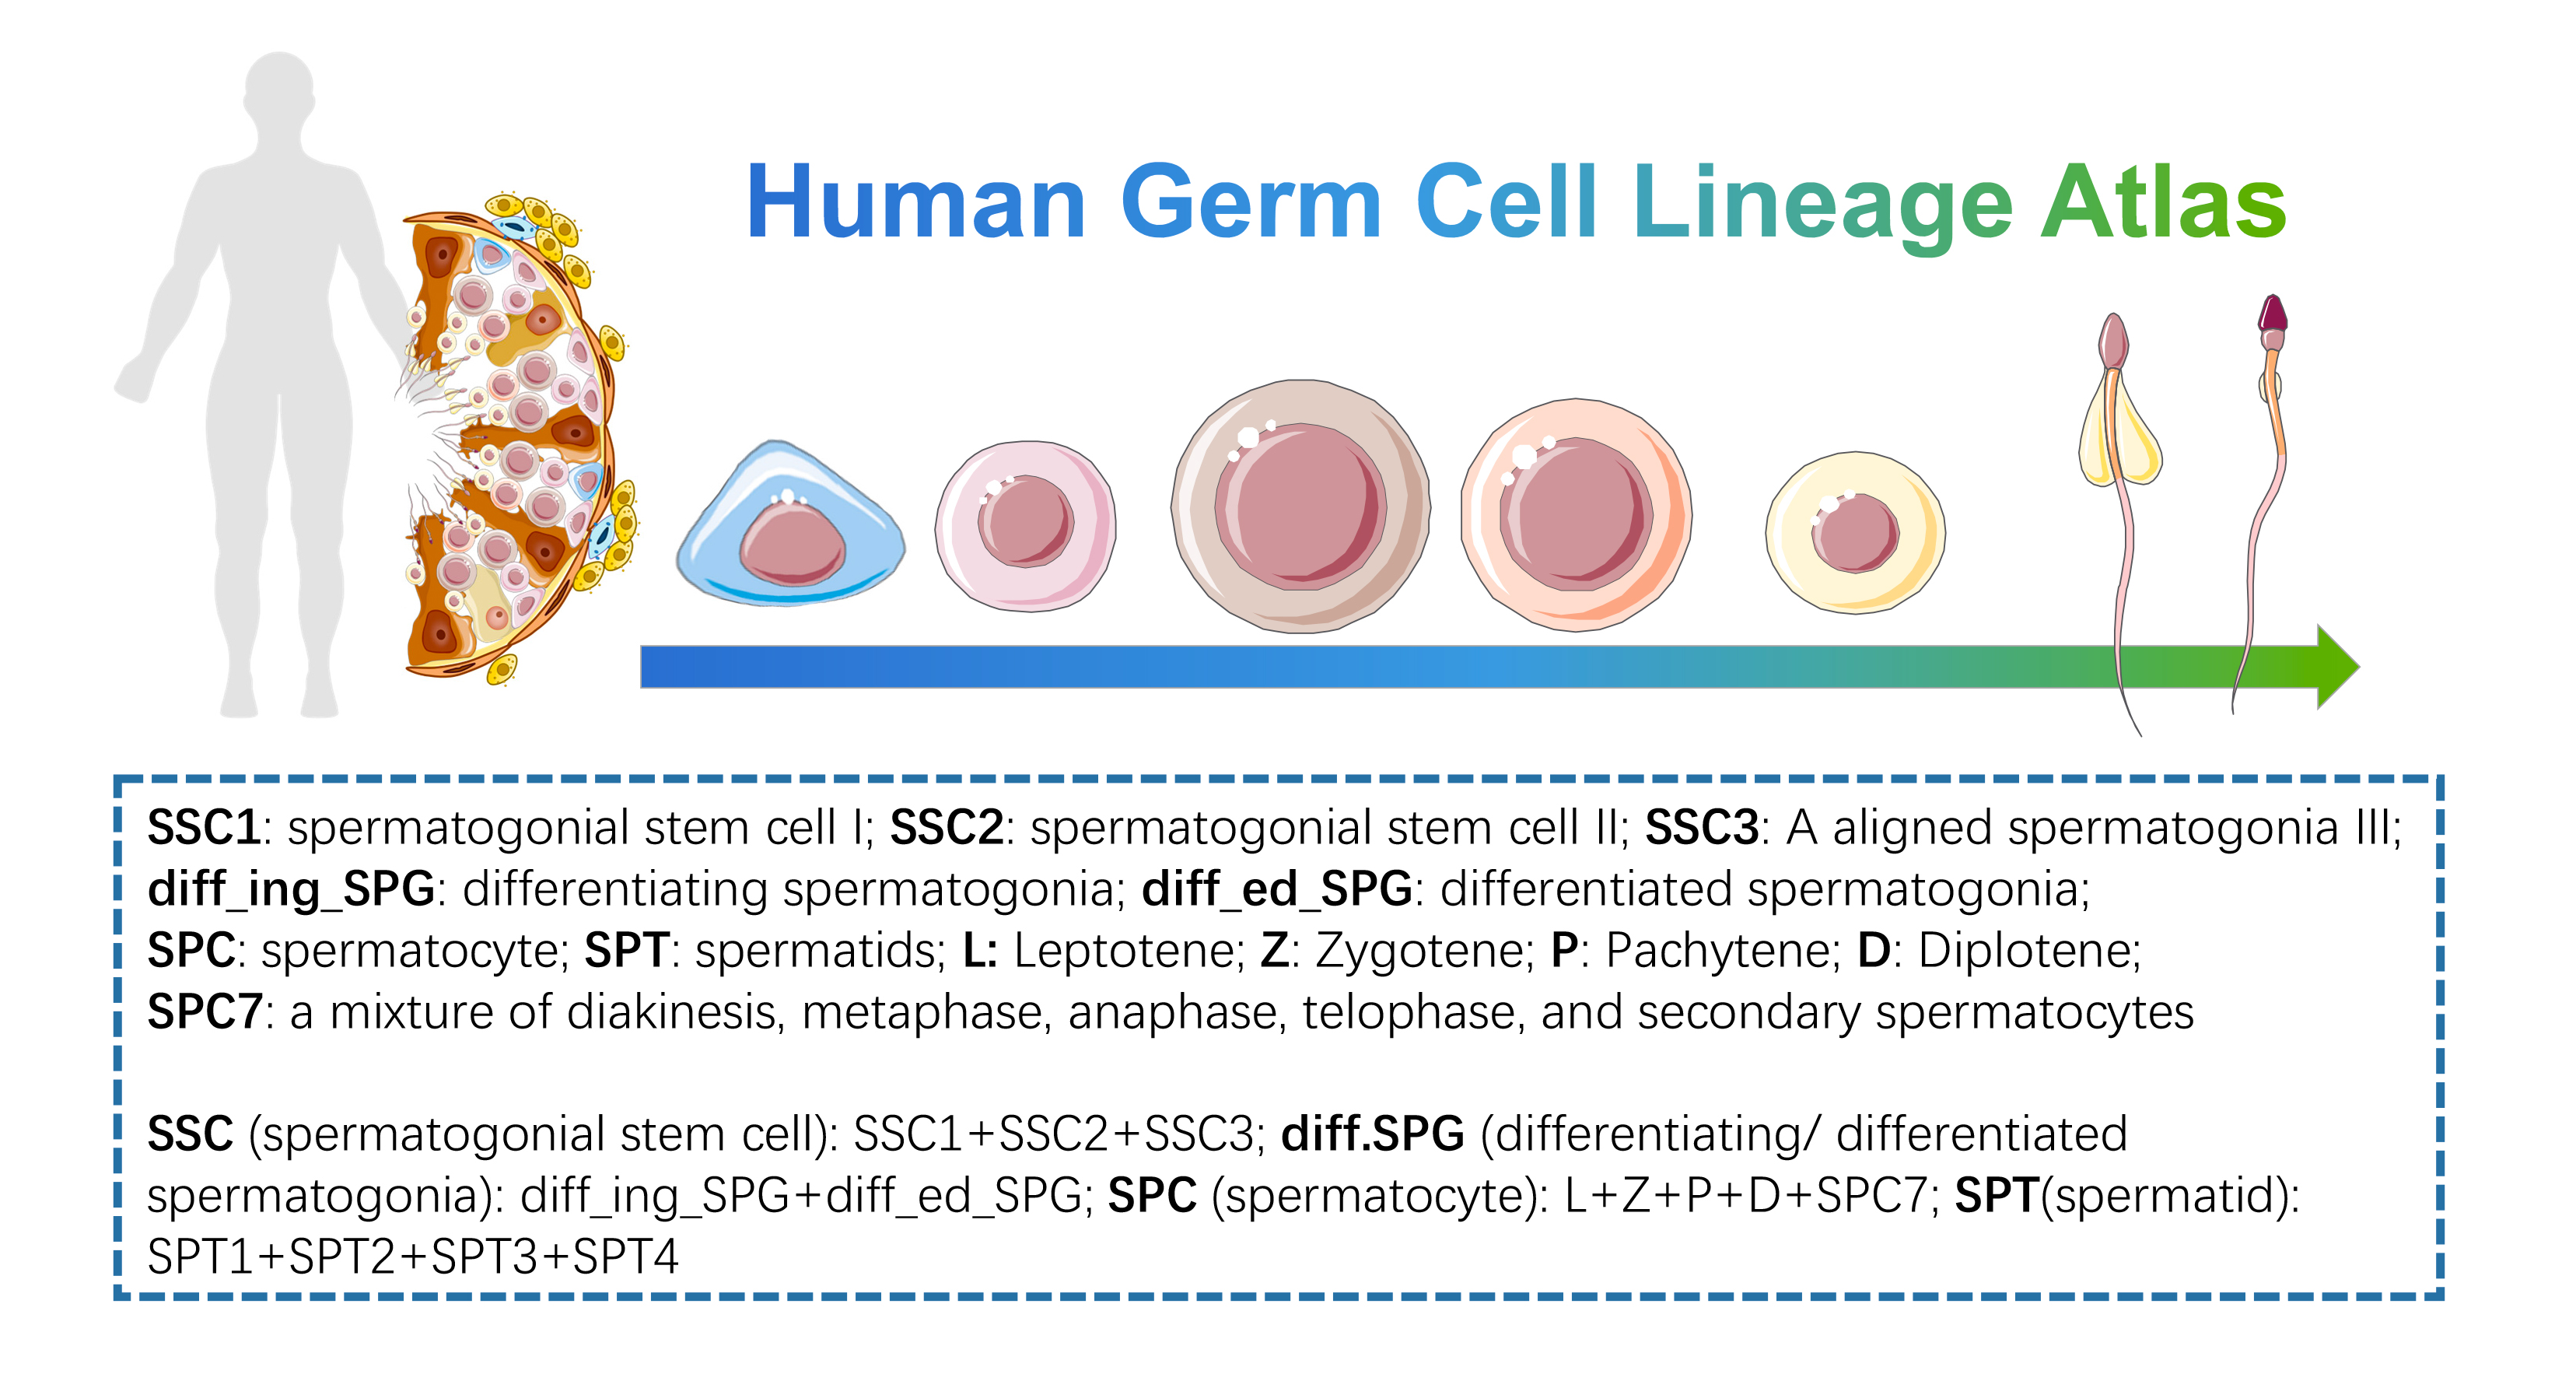
  • Human Germ Cell Lineage Atlas: this dataset is the germ cell line subset of “Human Testis Development Atlas”, from spermatogonial stem cell to spermatid, we provide simple and detailed clustering classifications. Data could be downloaded from GSE149512 of GEO data base.
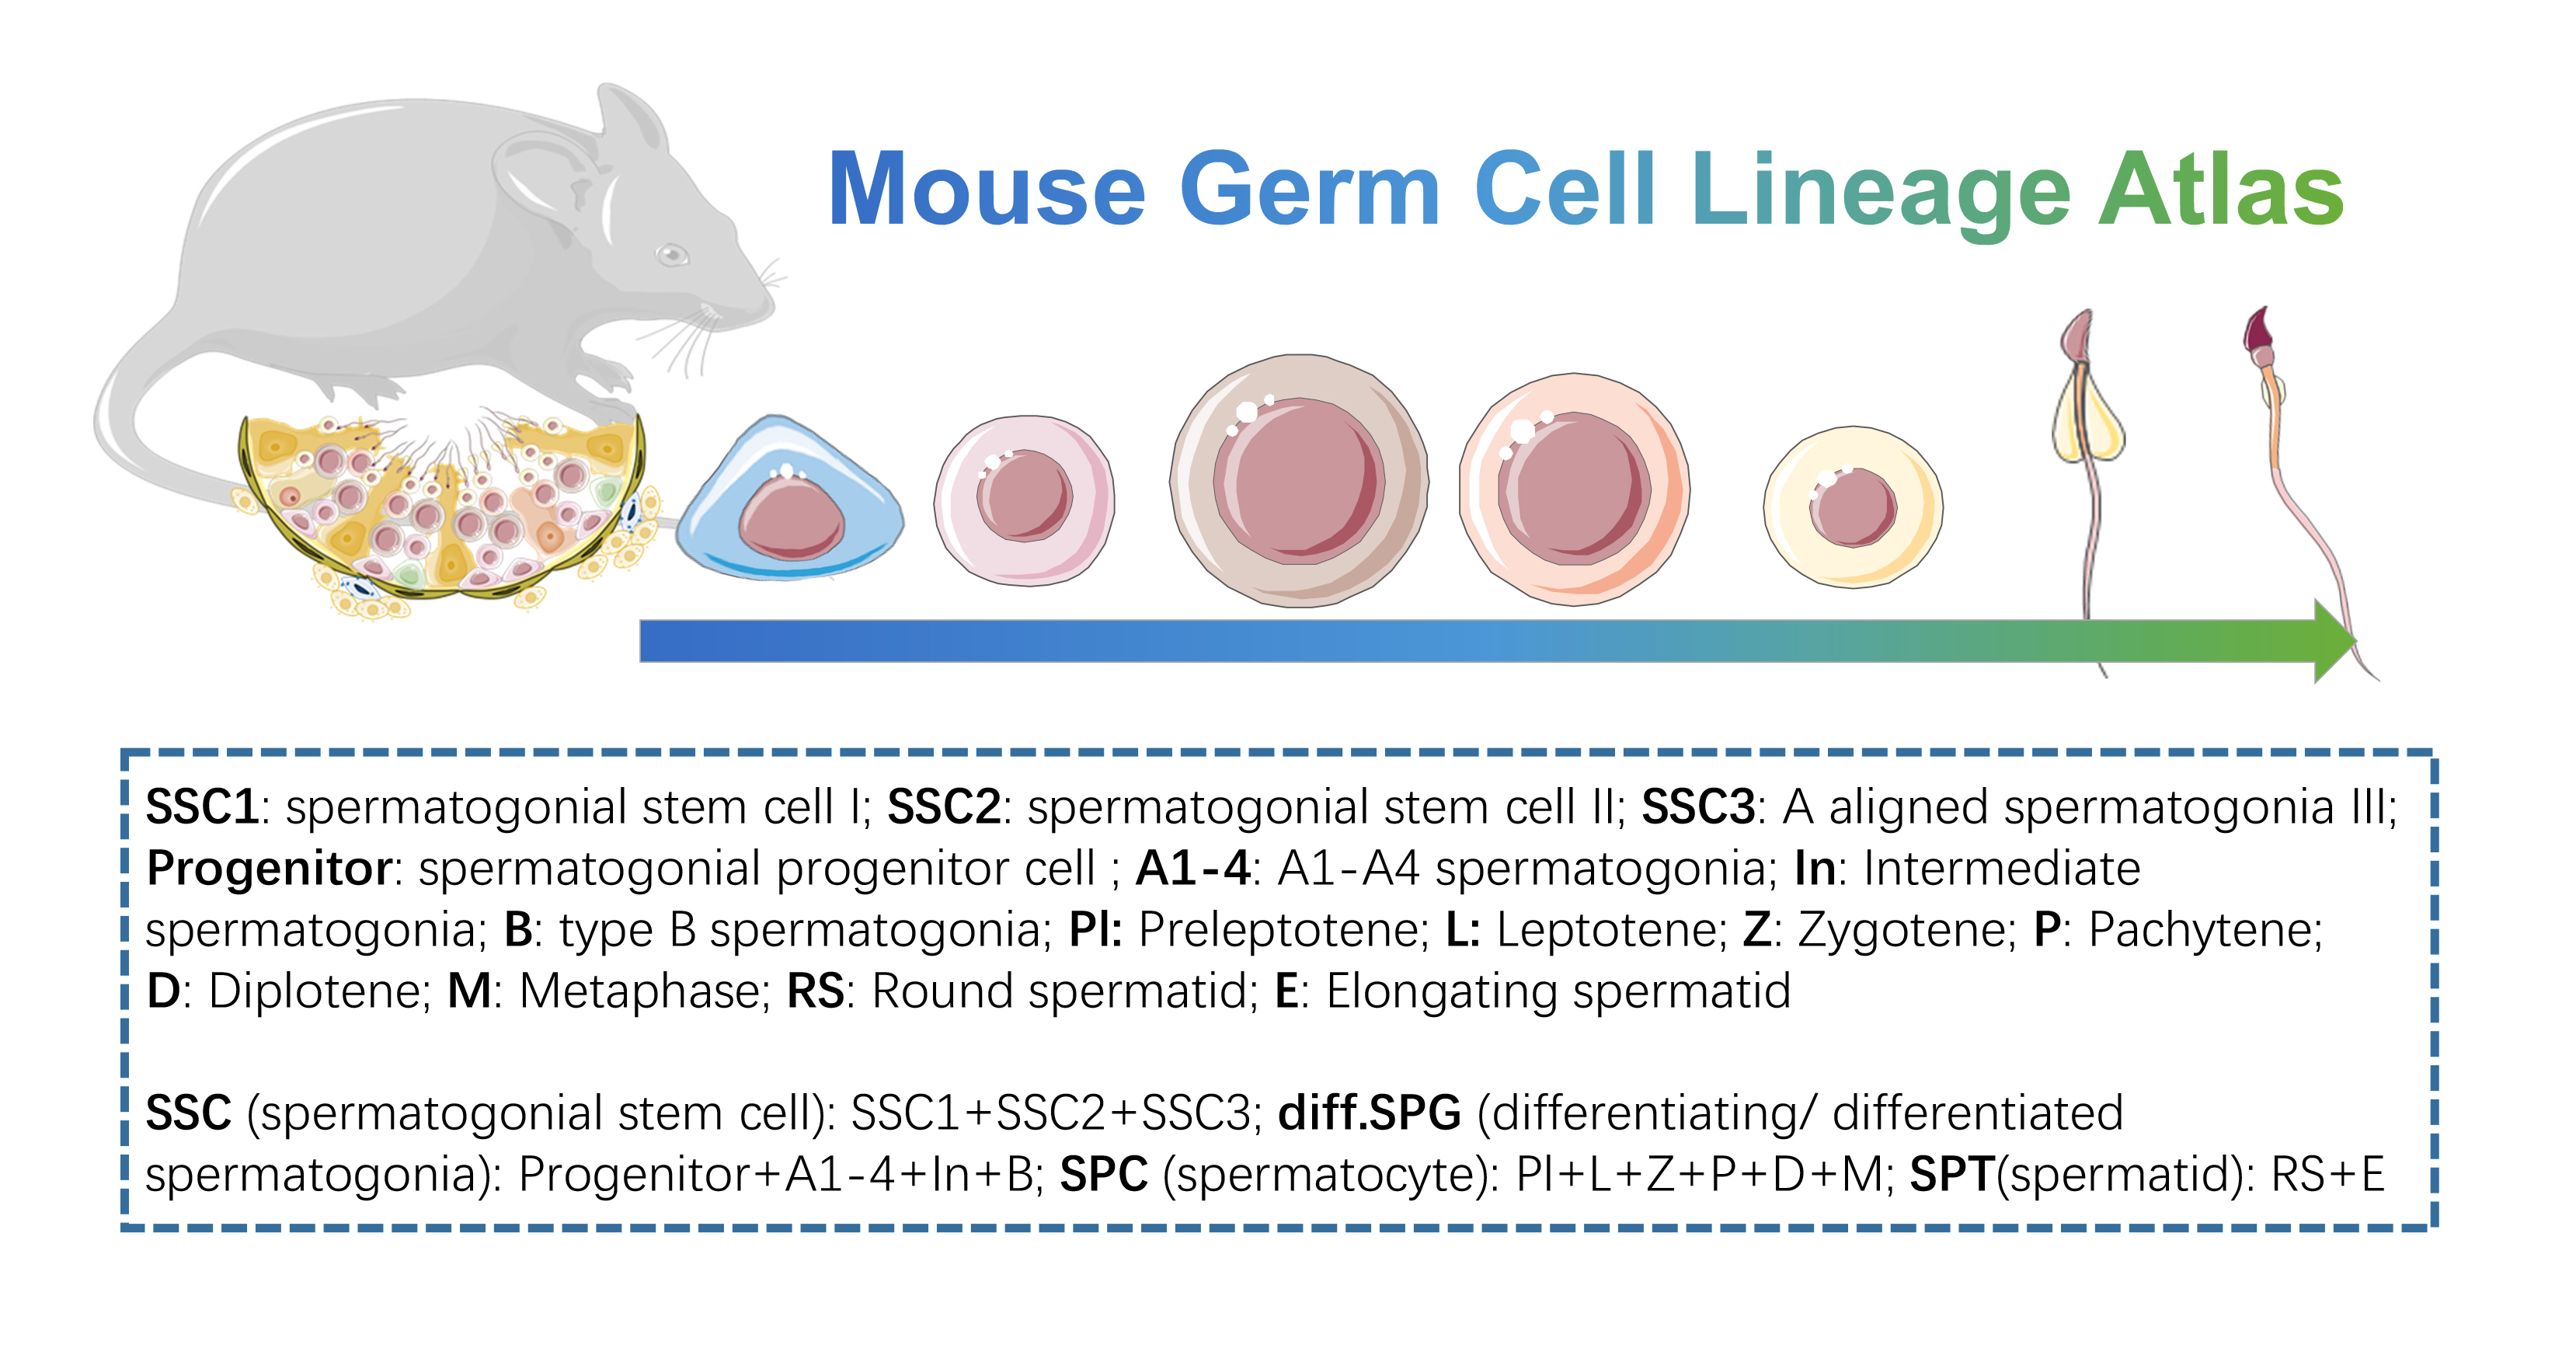
  • Mouse Germ Cell Lineage Atlas: this dataset is the germ cell line subset of “Mouse Testis Development Atlas”, from spermatogonial stem cell to spermatid, we provide simple and detailed clustering classifications. Data could be downloaded from GSE211115 of GEO data base.
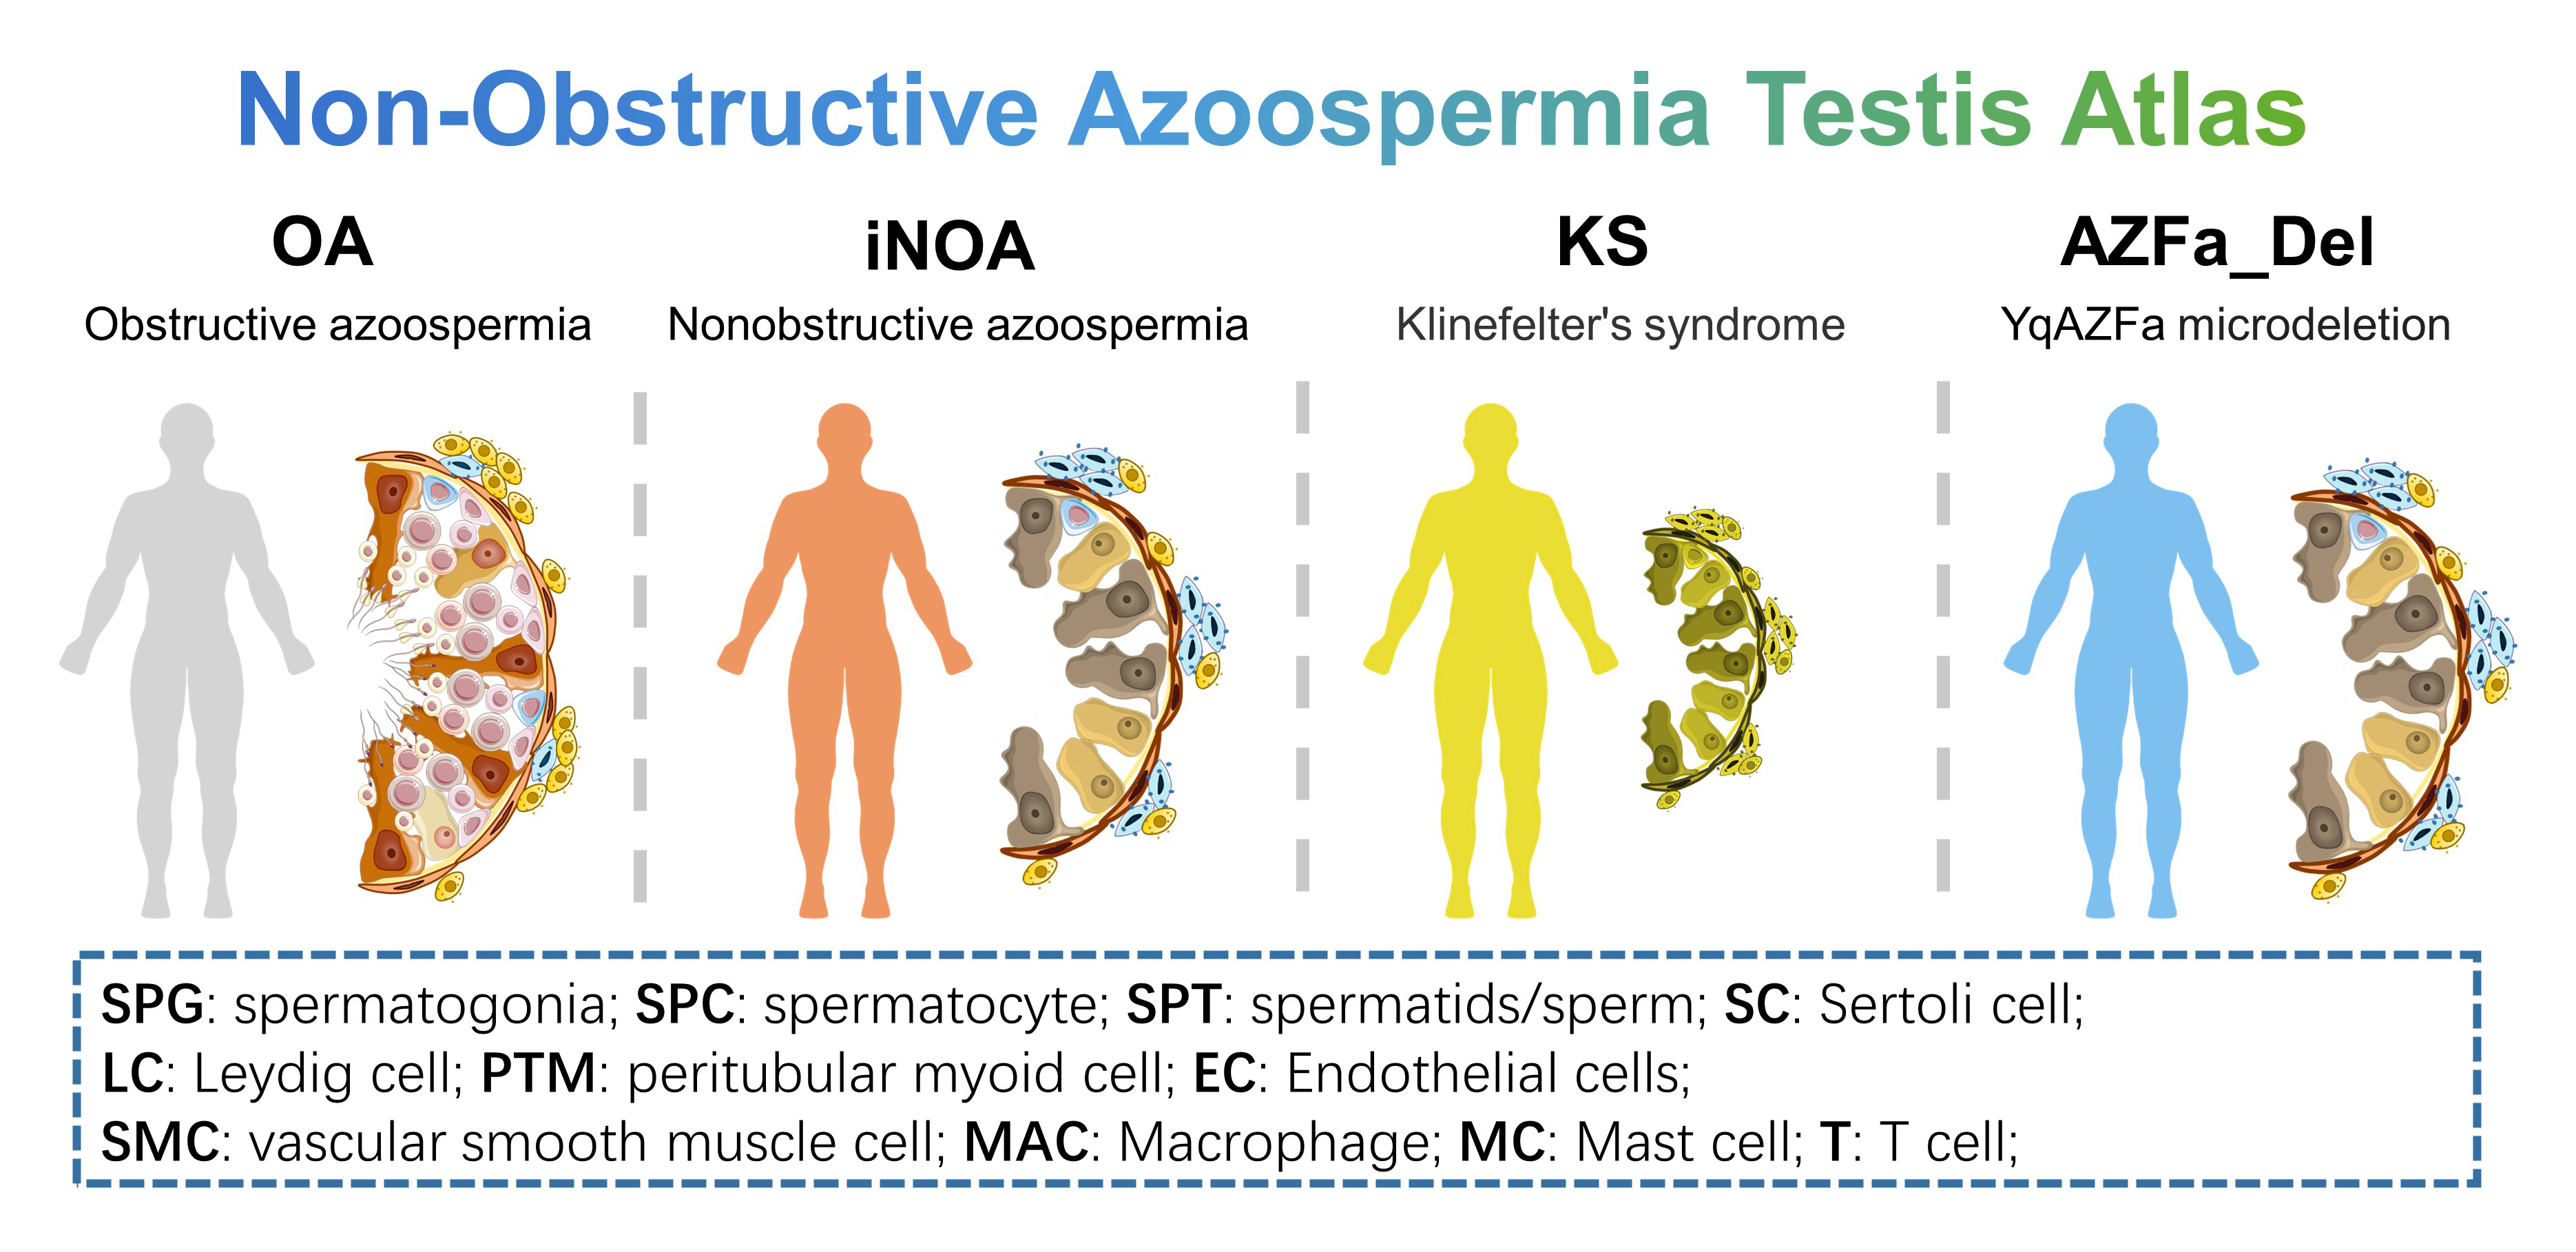
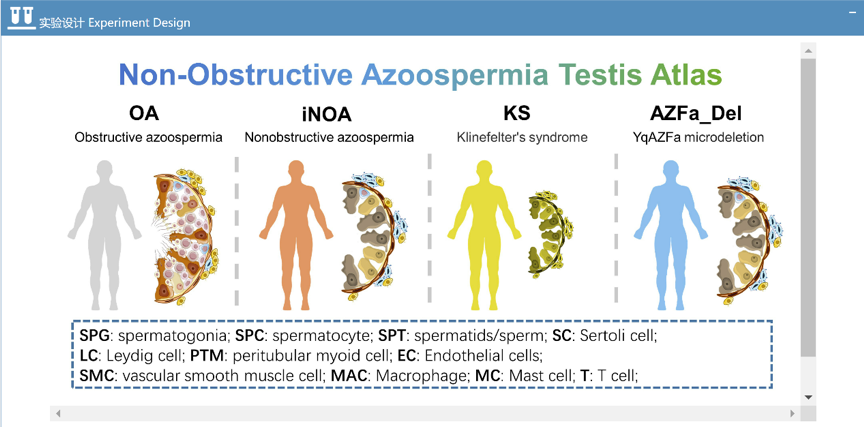
  • Human Testis Non-Obstructive Azoospermia Atlas: this dataset included 5 adult testicular samples with normal spermatogenesis and 7 testicular samples of non-obstructive azoospermia (NOA). NOA can be further classified as idiopathic nonobstructive azoospermia (n=3), Klinefelter's syndrome (n=3) and YqAZFa microdeletion (n=1) according to etiology. Data could be downloaded from GSE149512 of GEO data base.
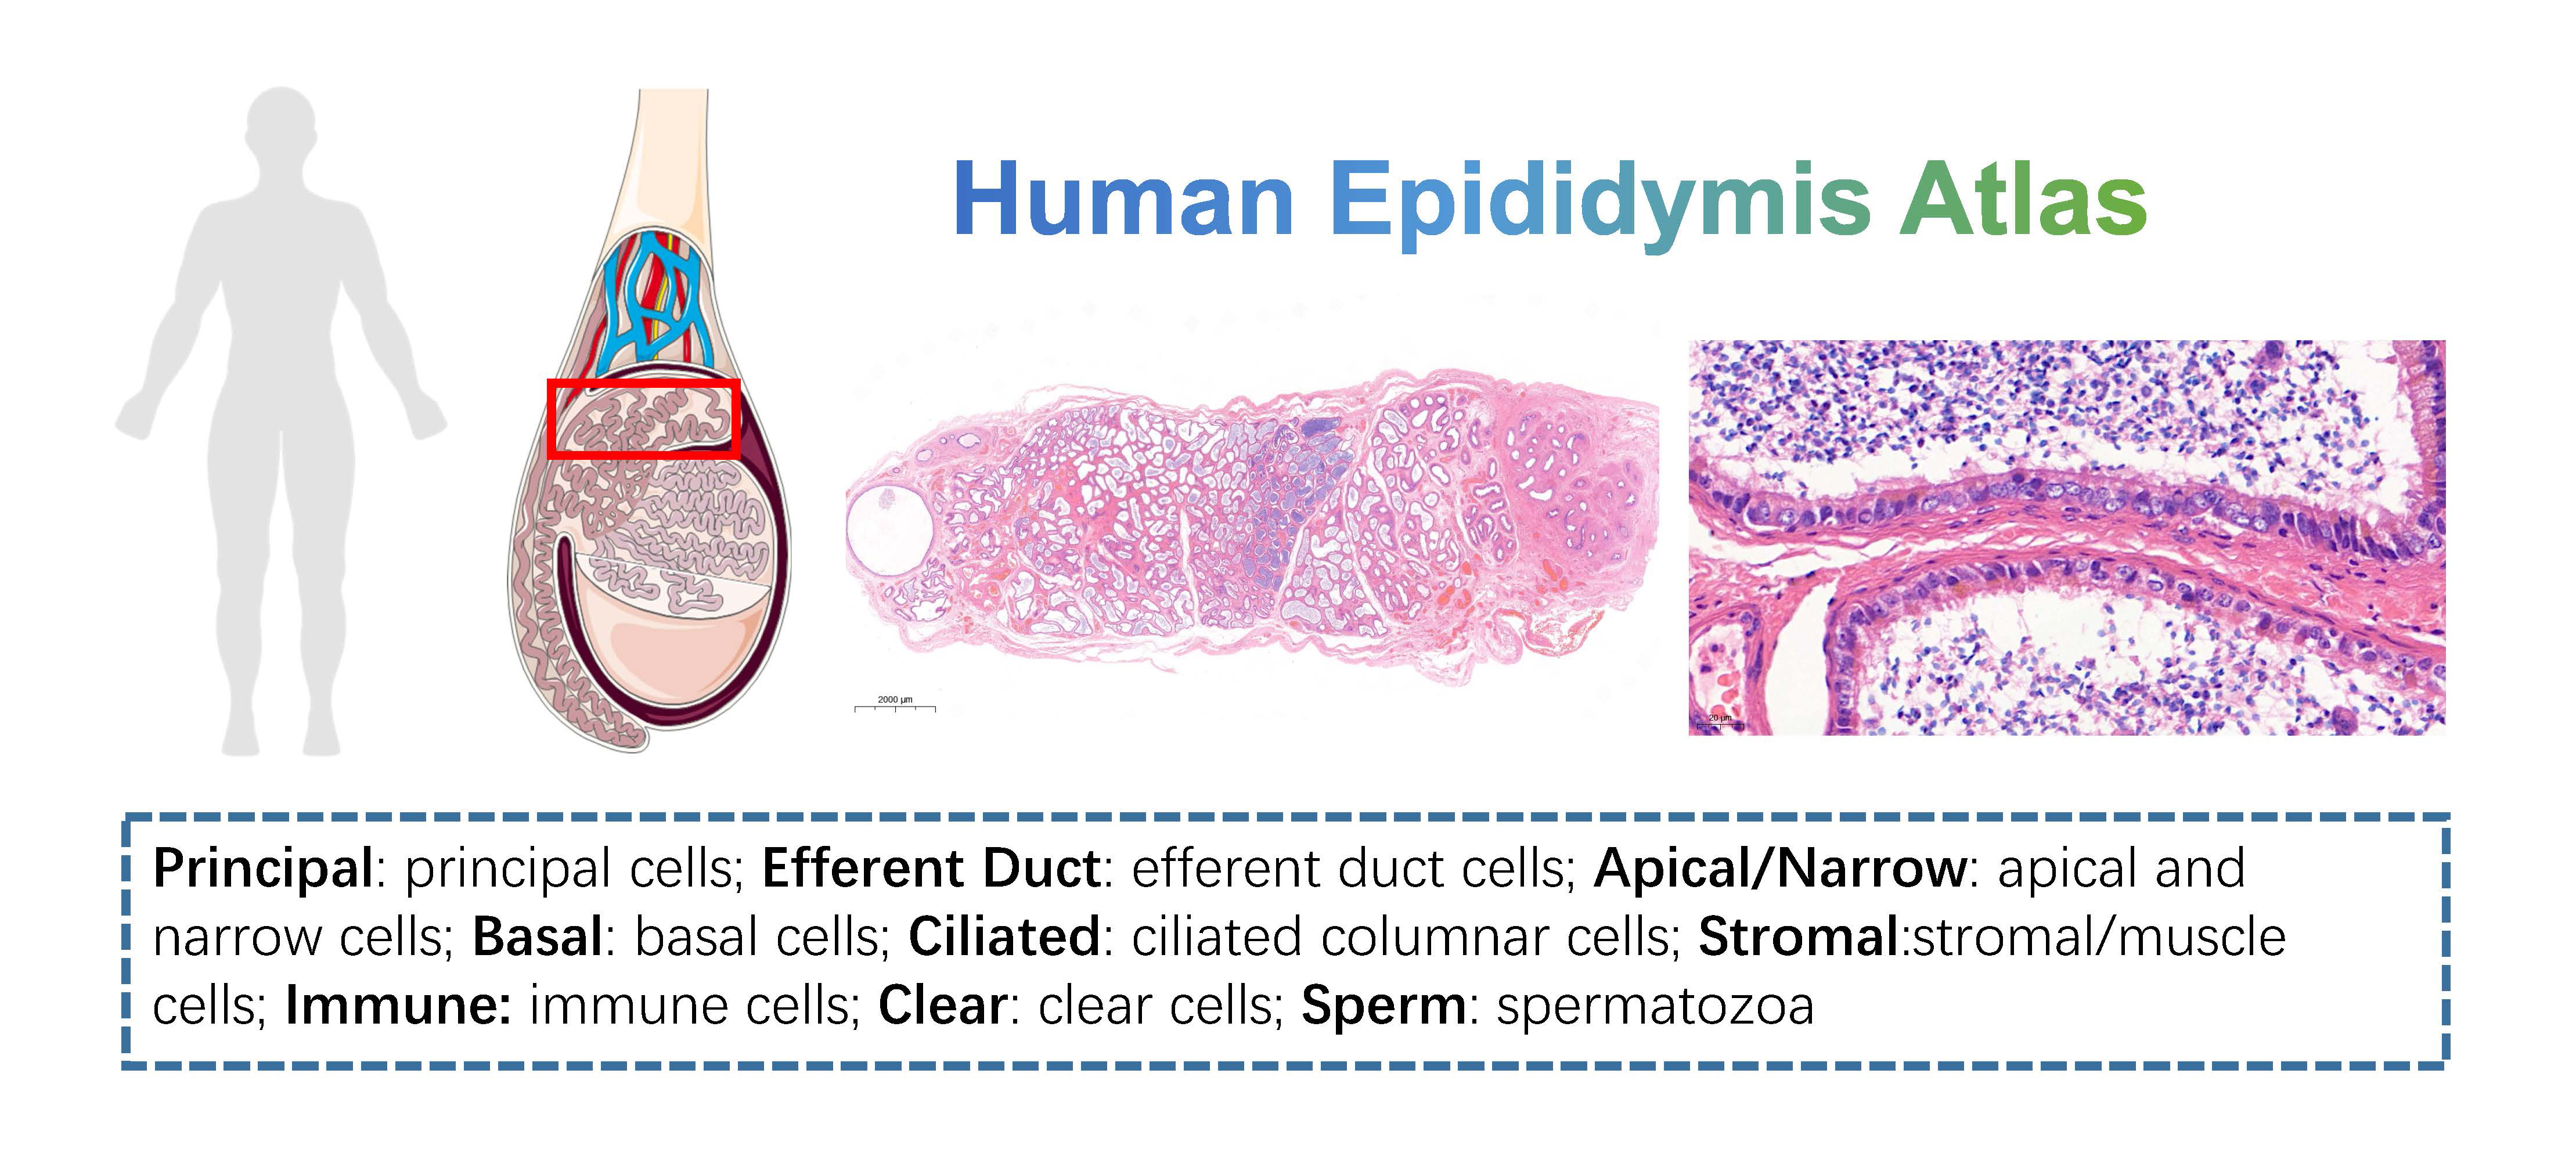
  • Human Epididymis Atlas: this dataset contains 3 caput epididymidis samples from normal adult. Data could be downloaded from GSE148963 of GEO data base.
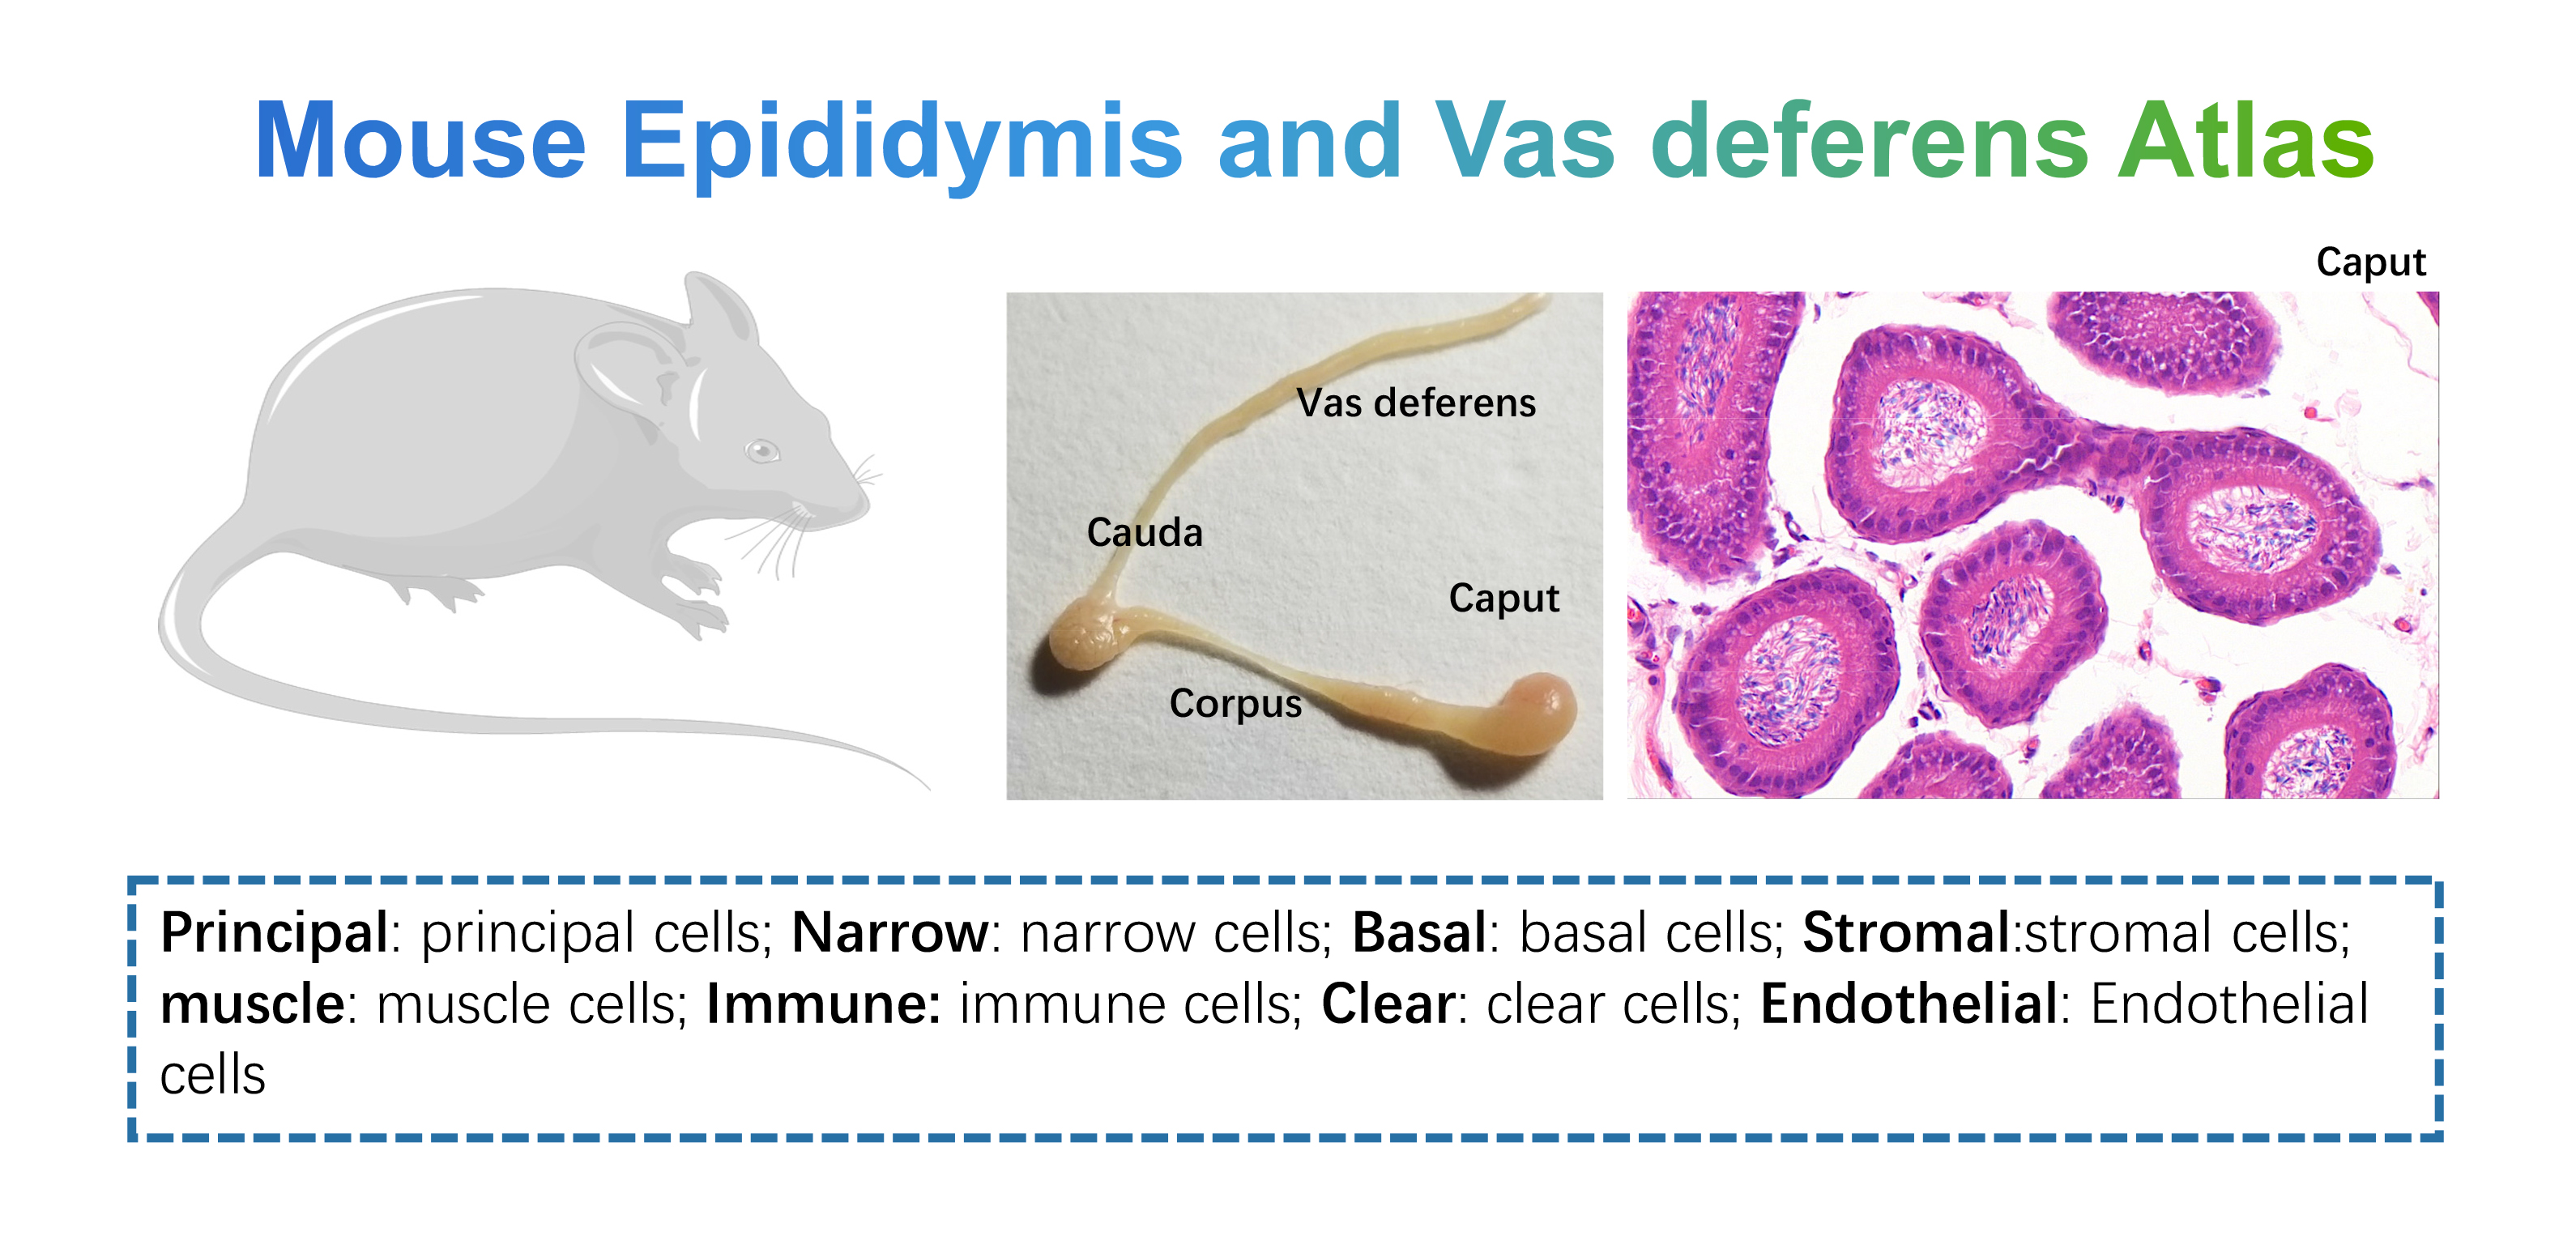
  • Mouse Epididymis Vas deferens Atlas: this dataset contains samples of Caput (n=1), Cauda (n=1), Corpus (n=1), and Vas deferens (n=1) from adult mice, we provide simple and detailed clustering classifications. Data could be downloaded from GSE145443 of GEO data base.
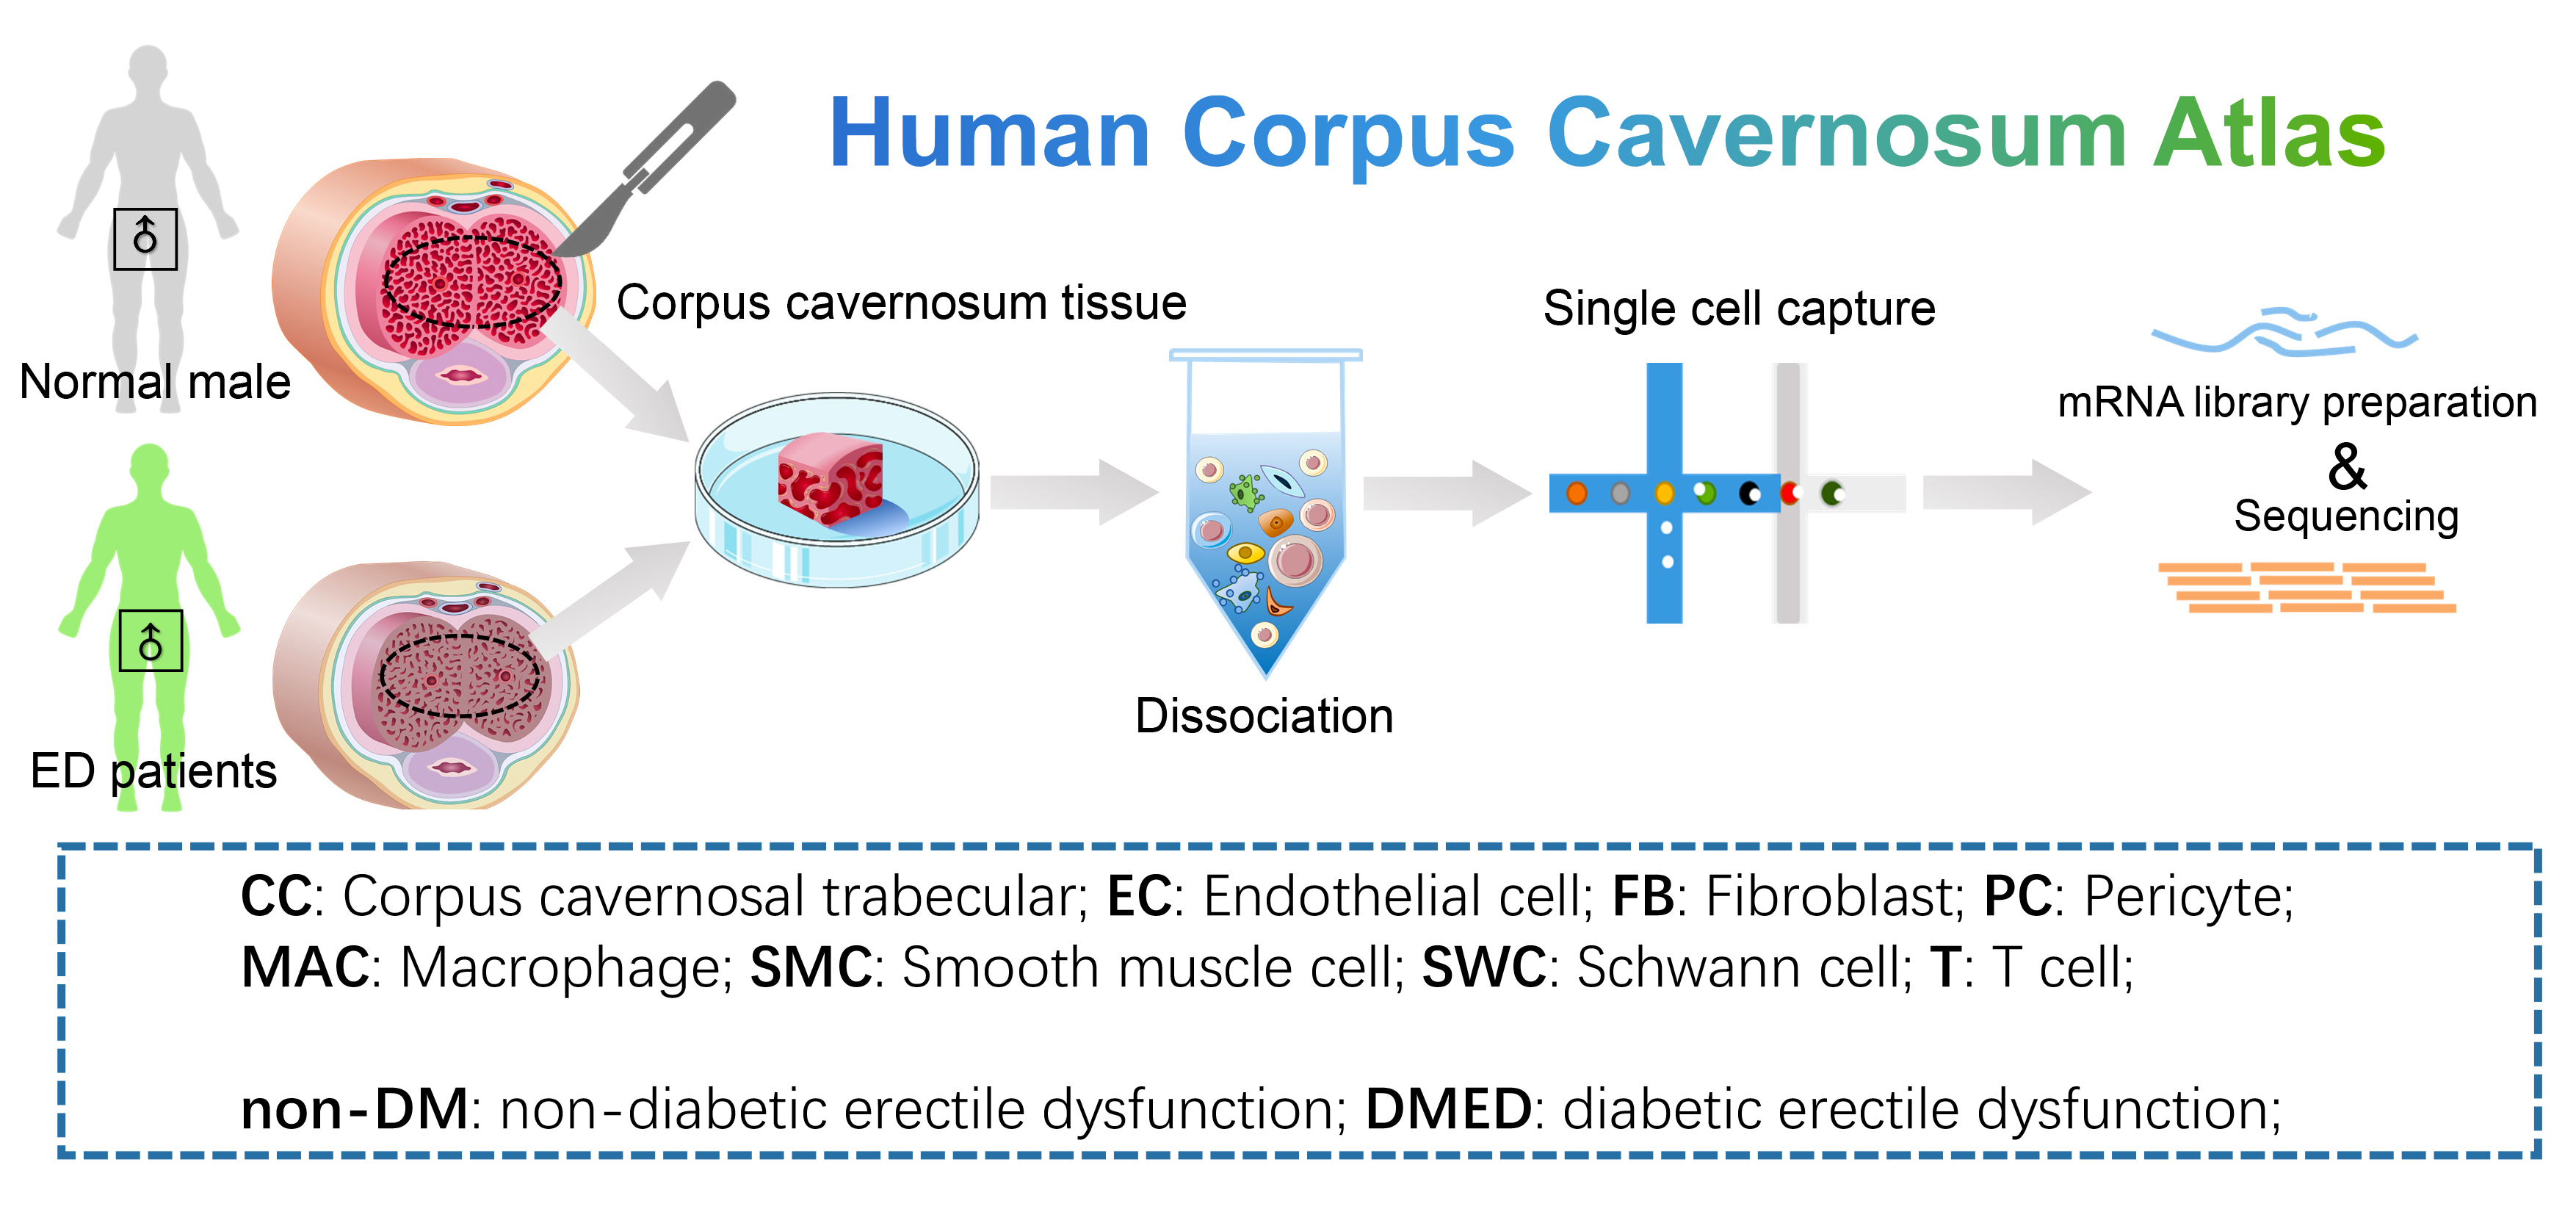
  • Human Corpus Cavernosum Atlas: 8 samples of corpus cavernosum from normal men (n=3) and erectile dysfunction patients (ED, n=6). ED patients can be further classified as non-diabetic ED (non-DM, n=3) and diabetic ED (DMED, n=3). We provide simple and detailed clustering classifications. Data could be downloaded from GSE206528 and GSE259348 of GEO data base.
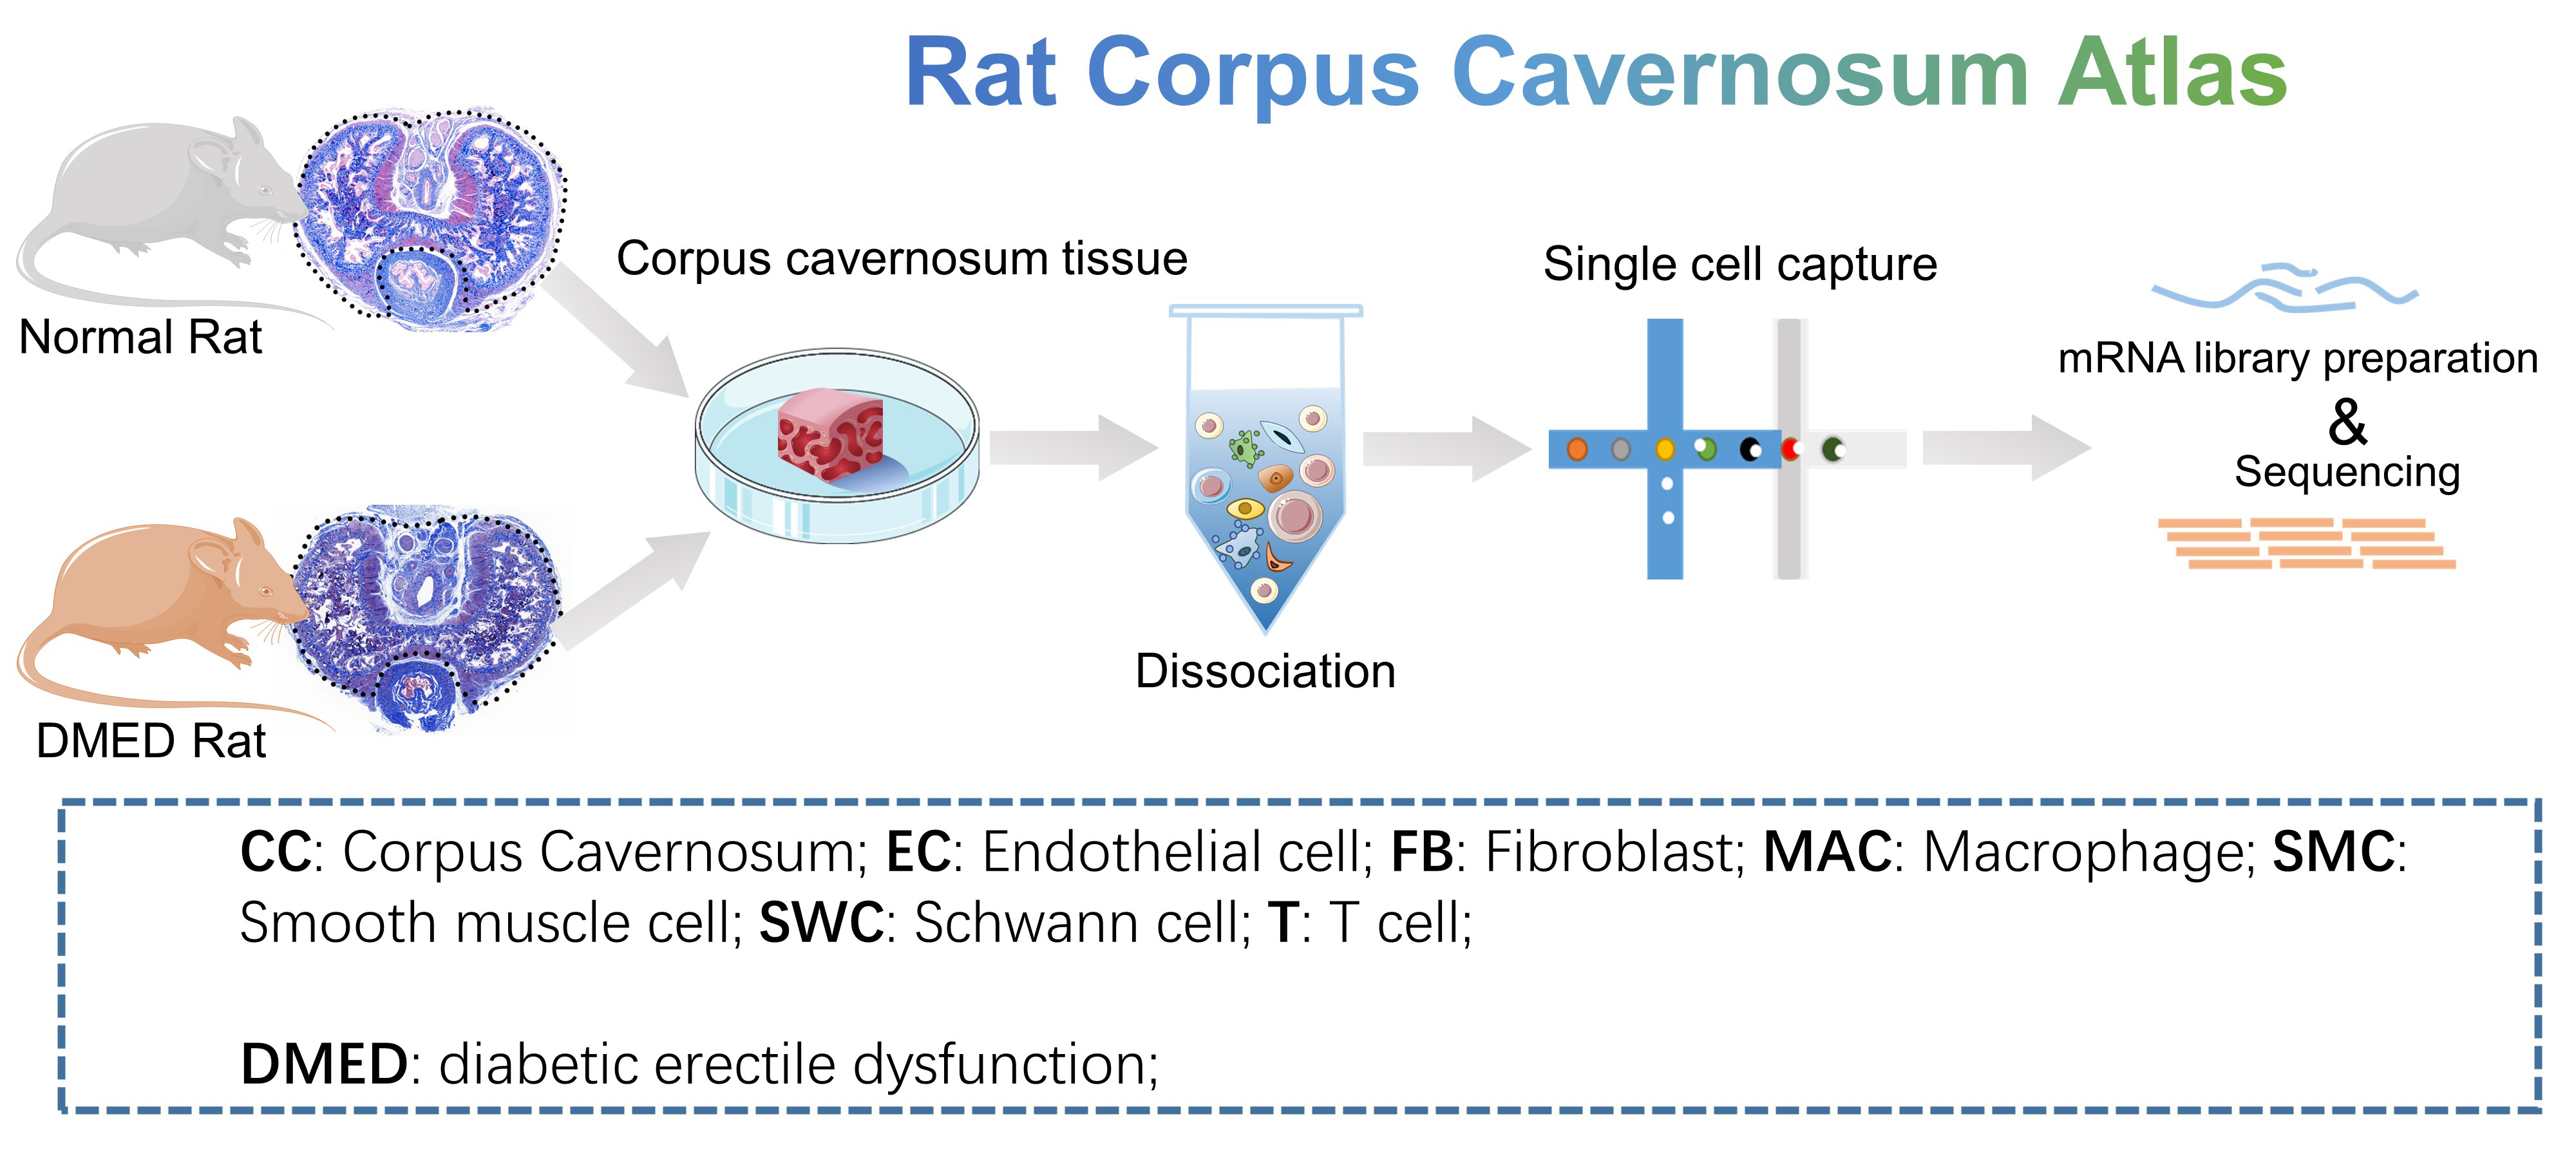
  • Rat Corpus Cavernosum Atlas: 6 samples of corpus cavernosum from normal rats (normal, n=2) and diabetes mellitus erectile dysfunction rats (DMED, n=4). For the DMED rat model, streptozotocin (STZ) was injected intraperitoneally at a dose of 60 mg/kg. Corpus cavernosum tissues were collected after 4 weeks of the model was successfully established. We provide simple and detailed clustering classifications. Data could be downloaded from GSE259299 of GEO data base.
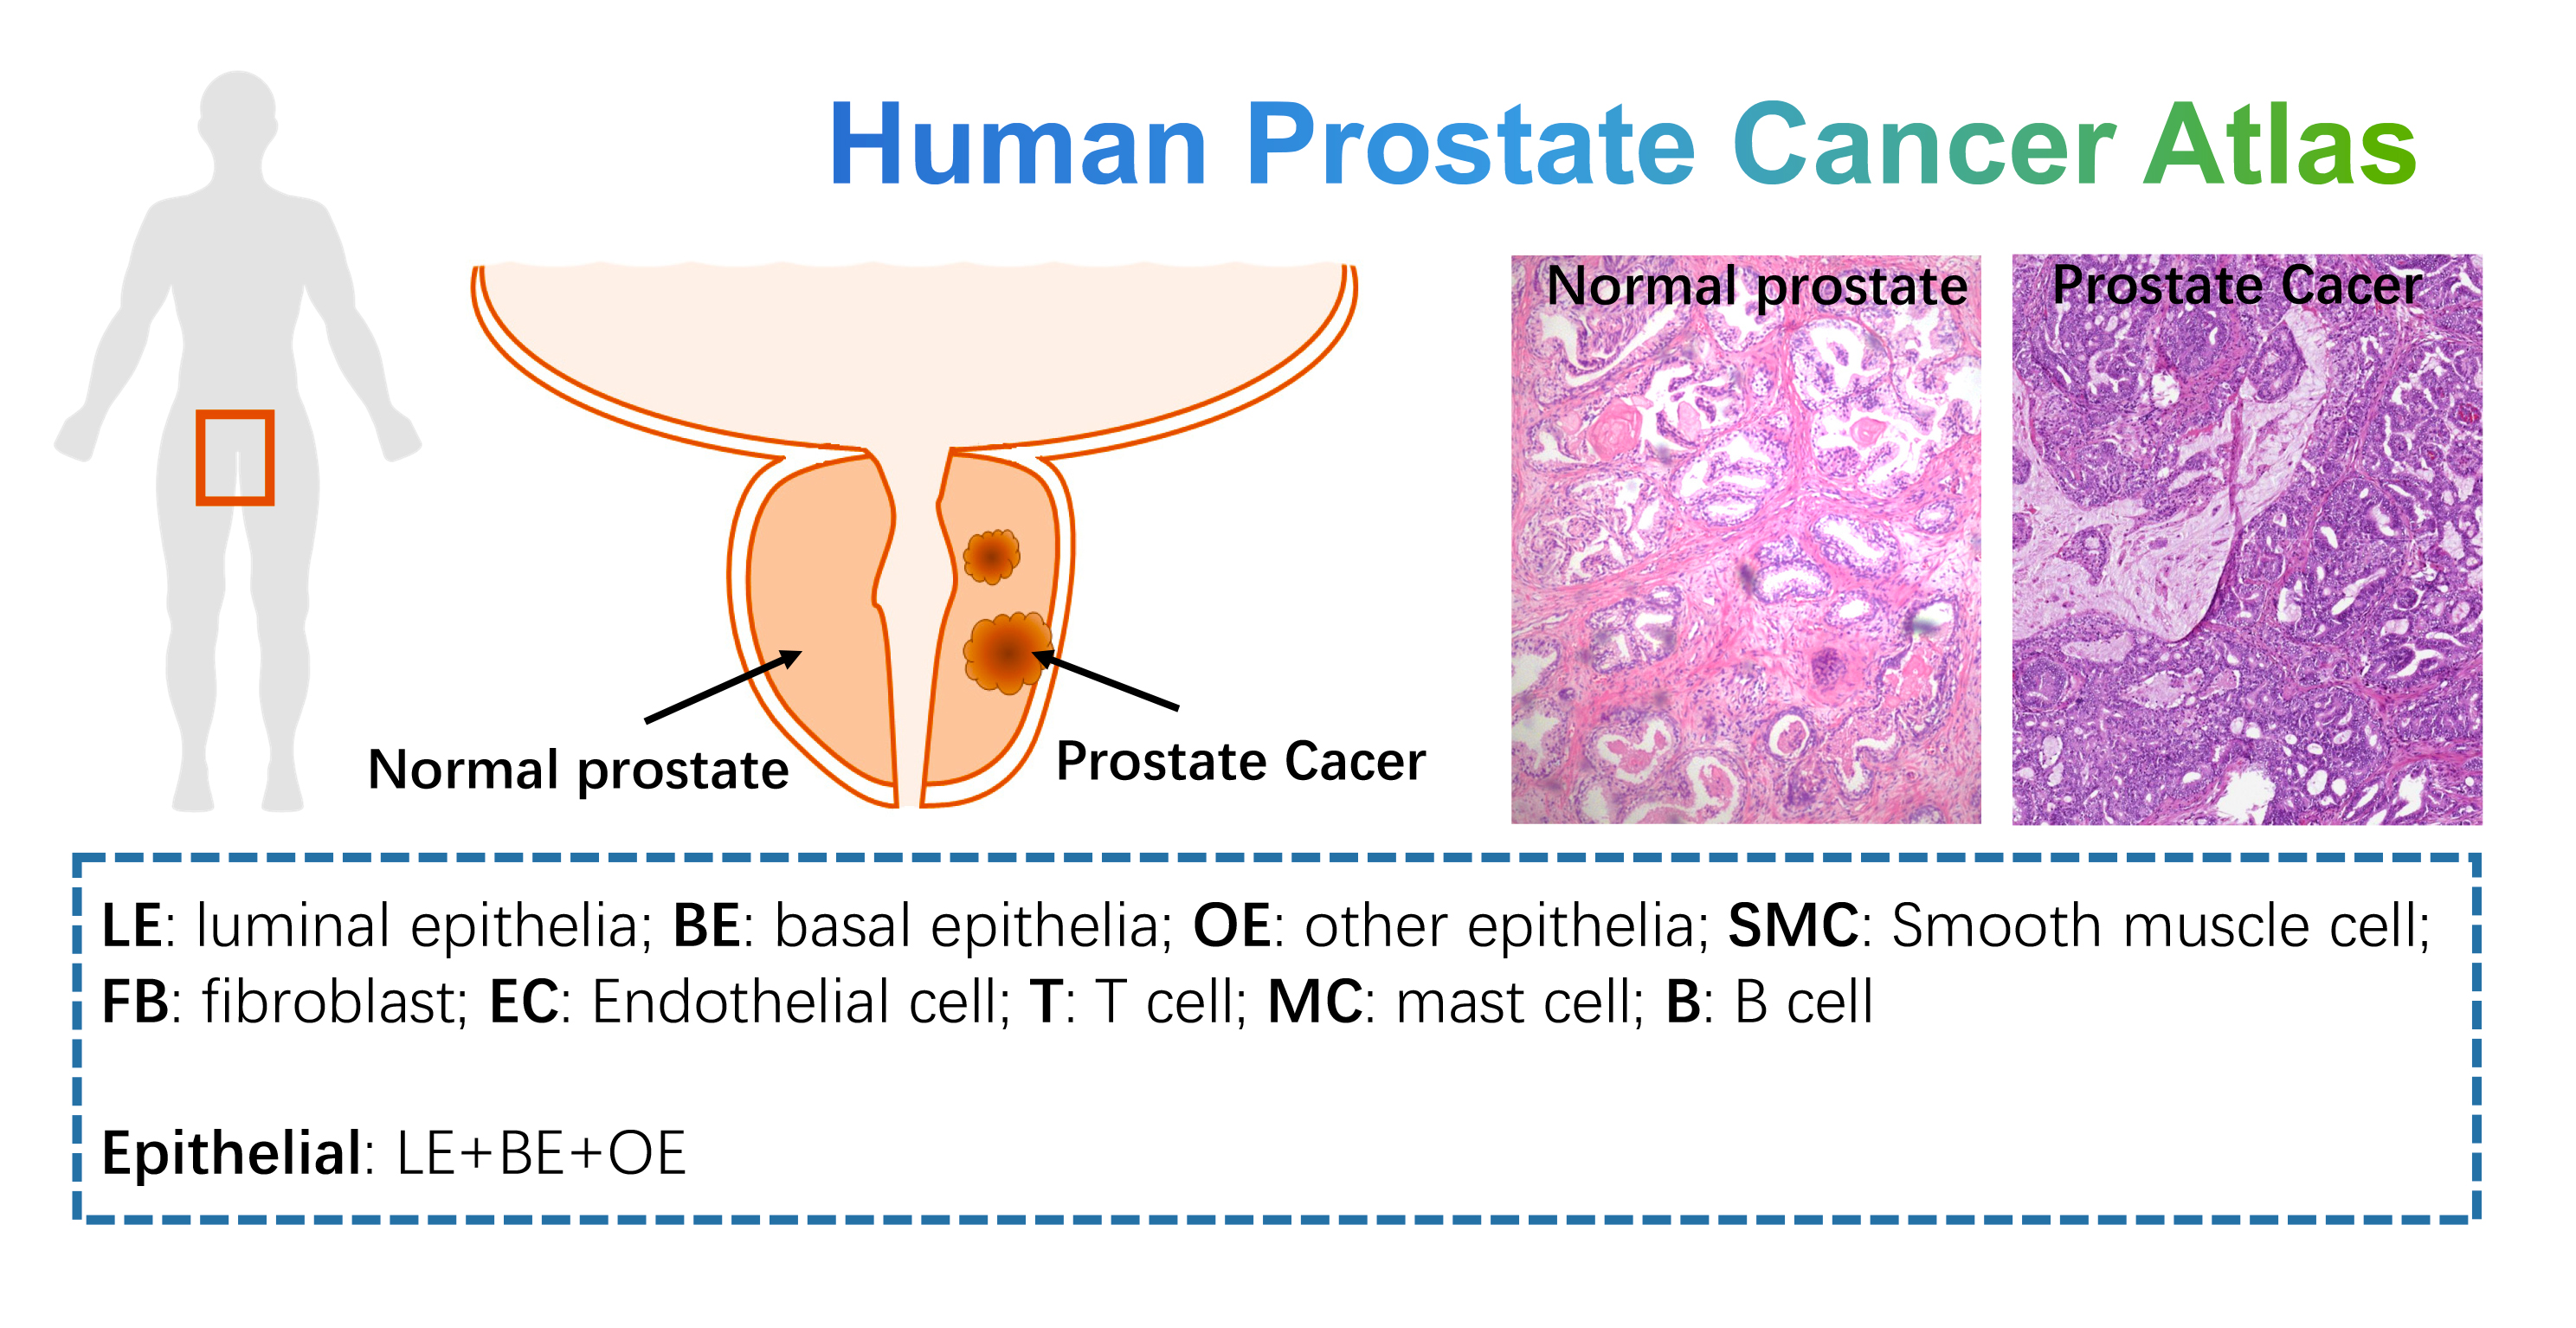
  • Human Prostate Cancer Atlas: this dataset contains 19 human prostate samples from 3 normal prostates and 16 prostate cancers. We provide simple and detailed clustering classifications according to the original study description. Data could be downloaded from GSE120716 and GSE141445 of GEO data base.
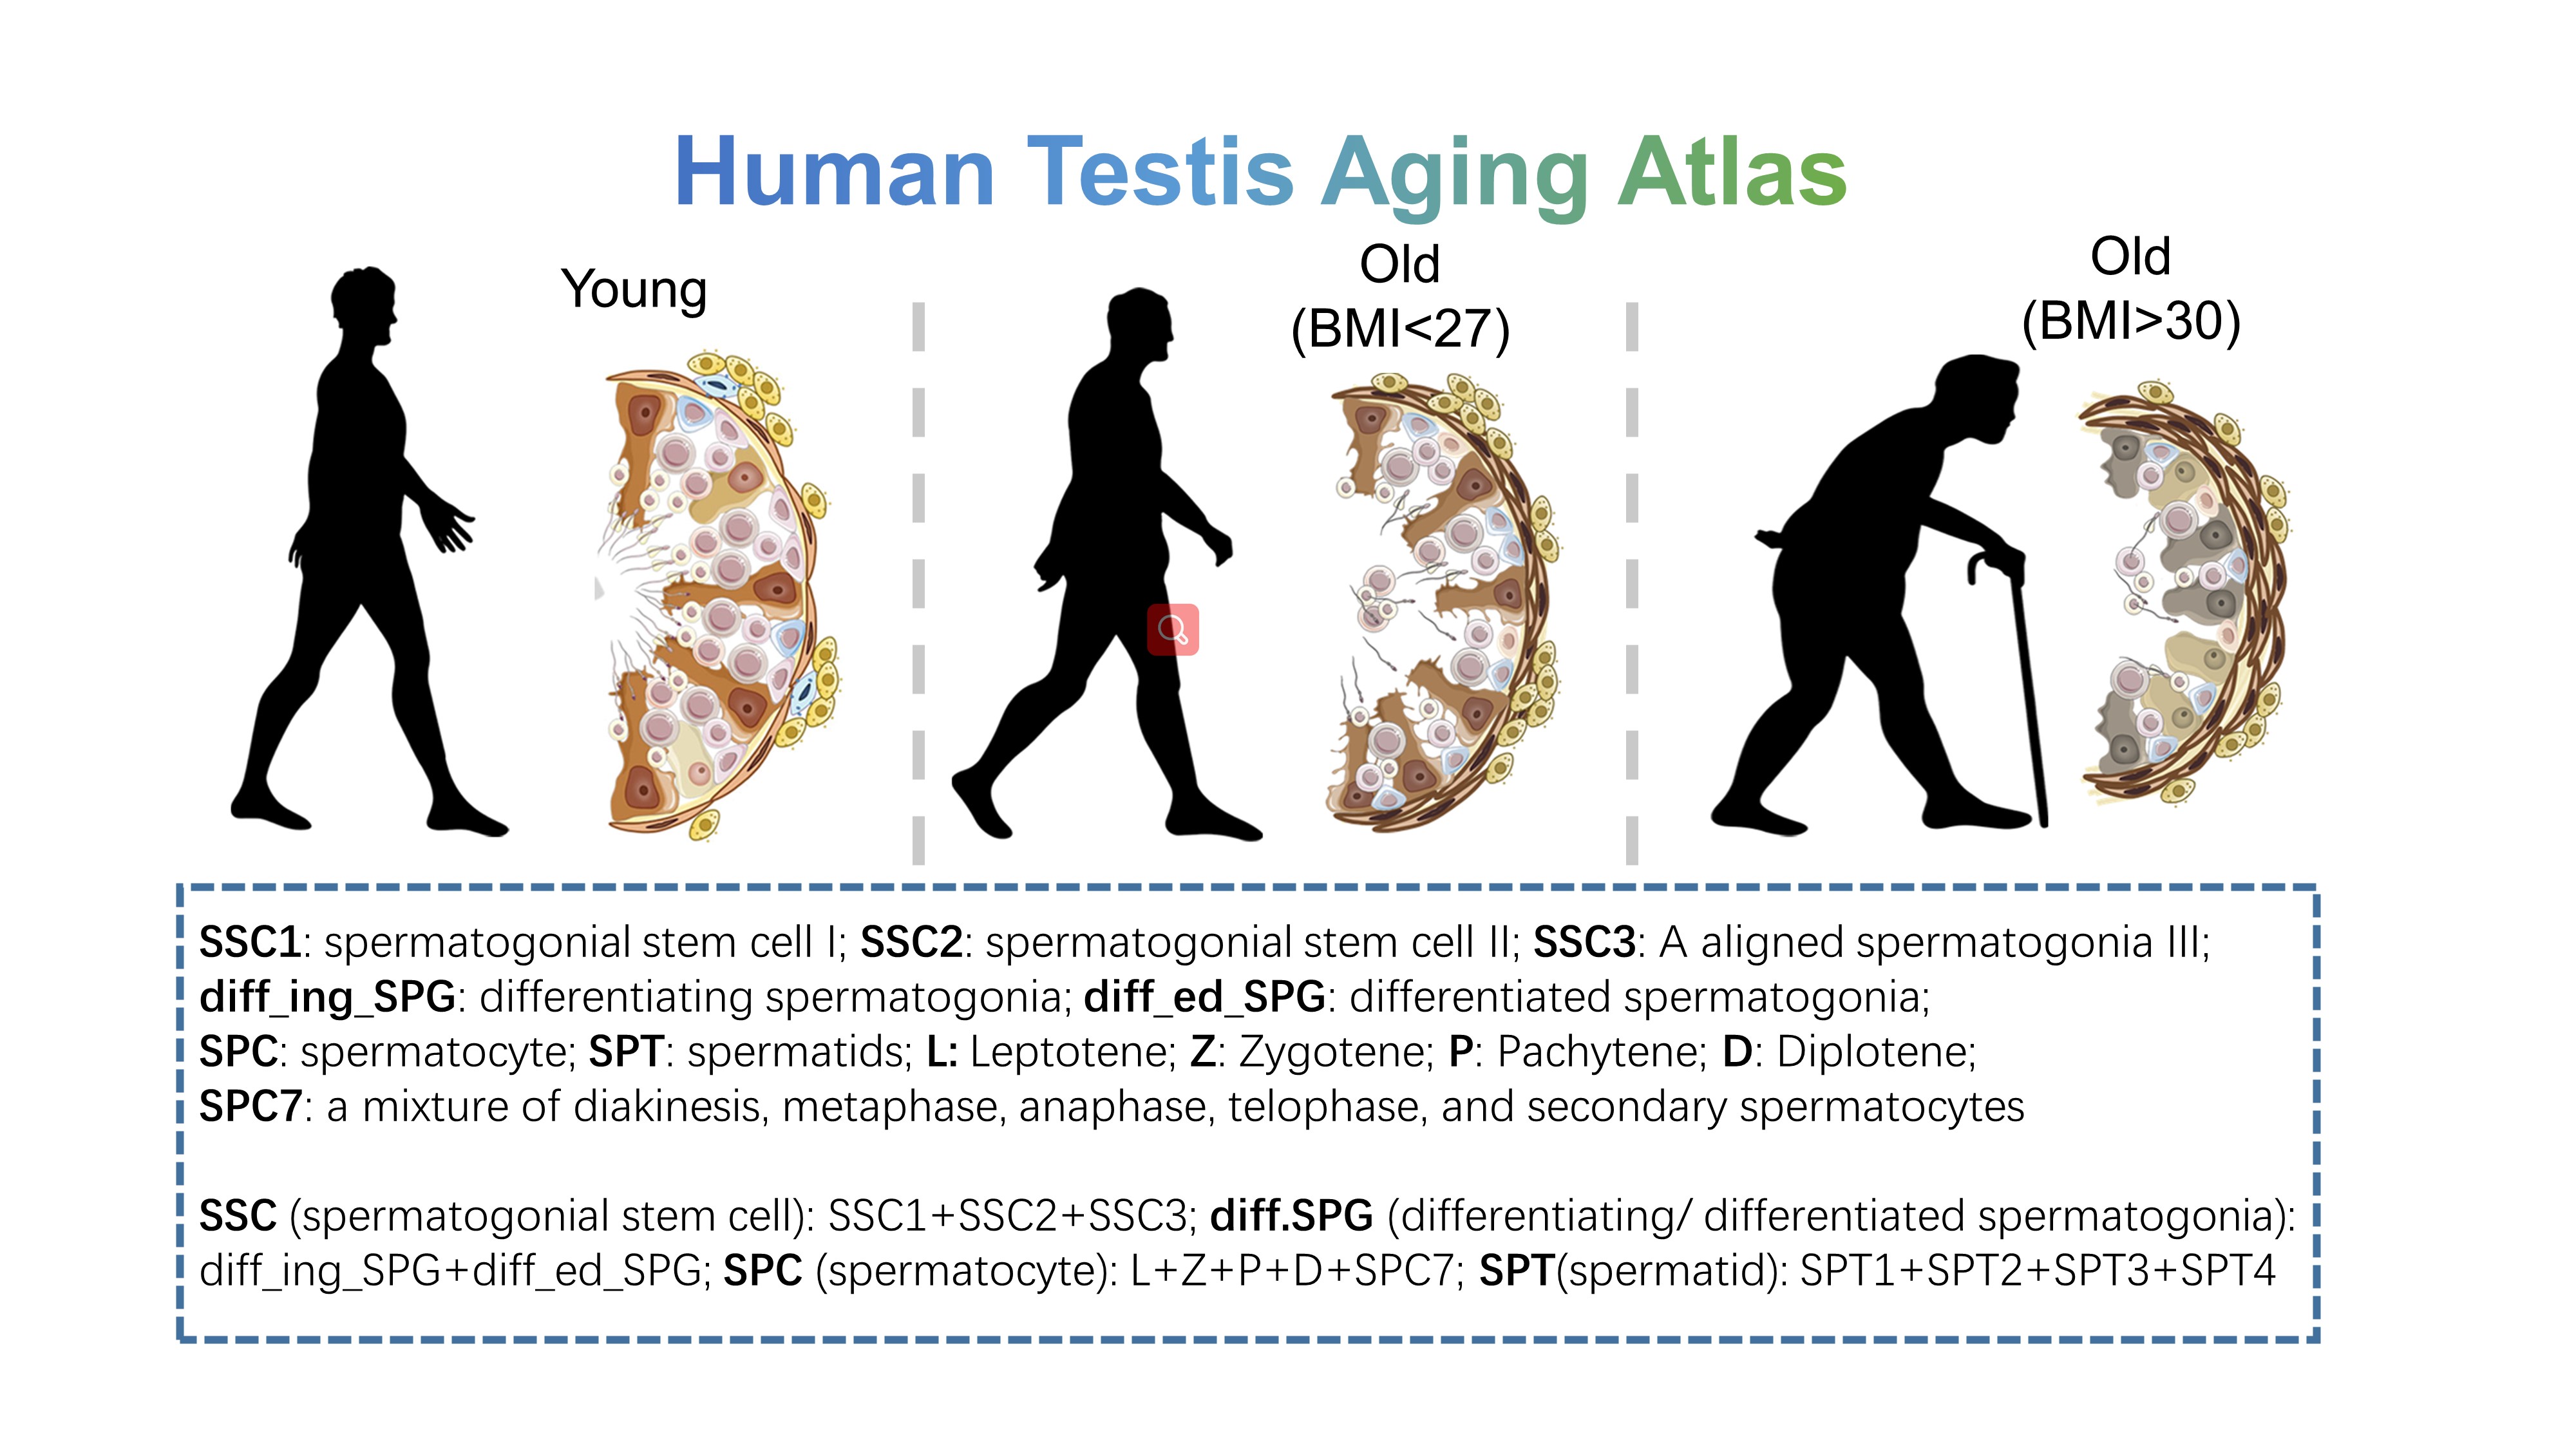
  • Human Testis Aging Atlas: 12 human testicular samples include normal young (n=4), normal old (n=3) and unhealthy old (n=5, with high body mass index), to show the aging process of human testis. Data could be downloaded from GSE182786 of GEO data base.
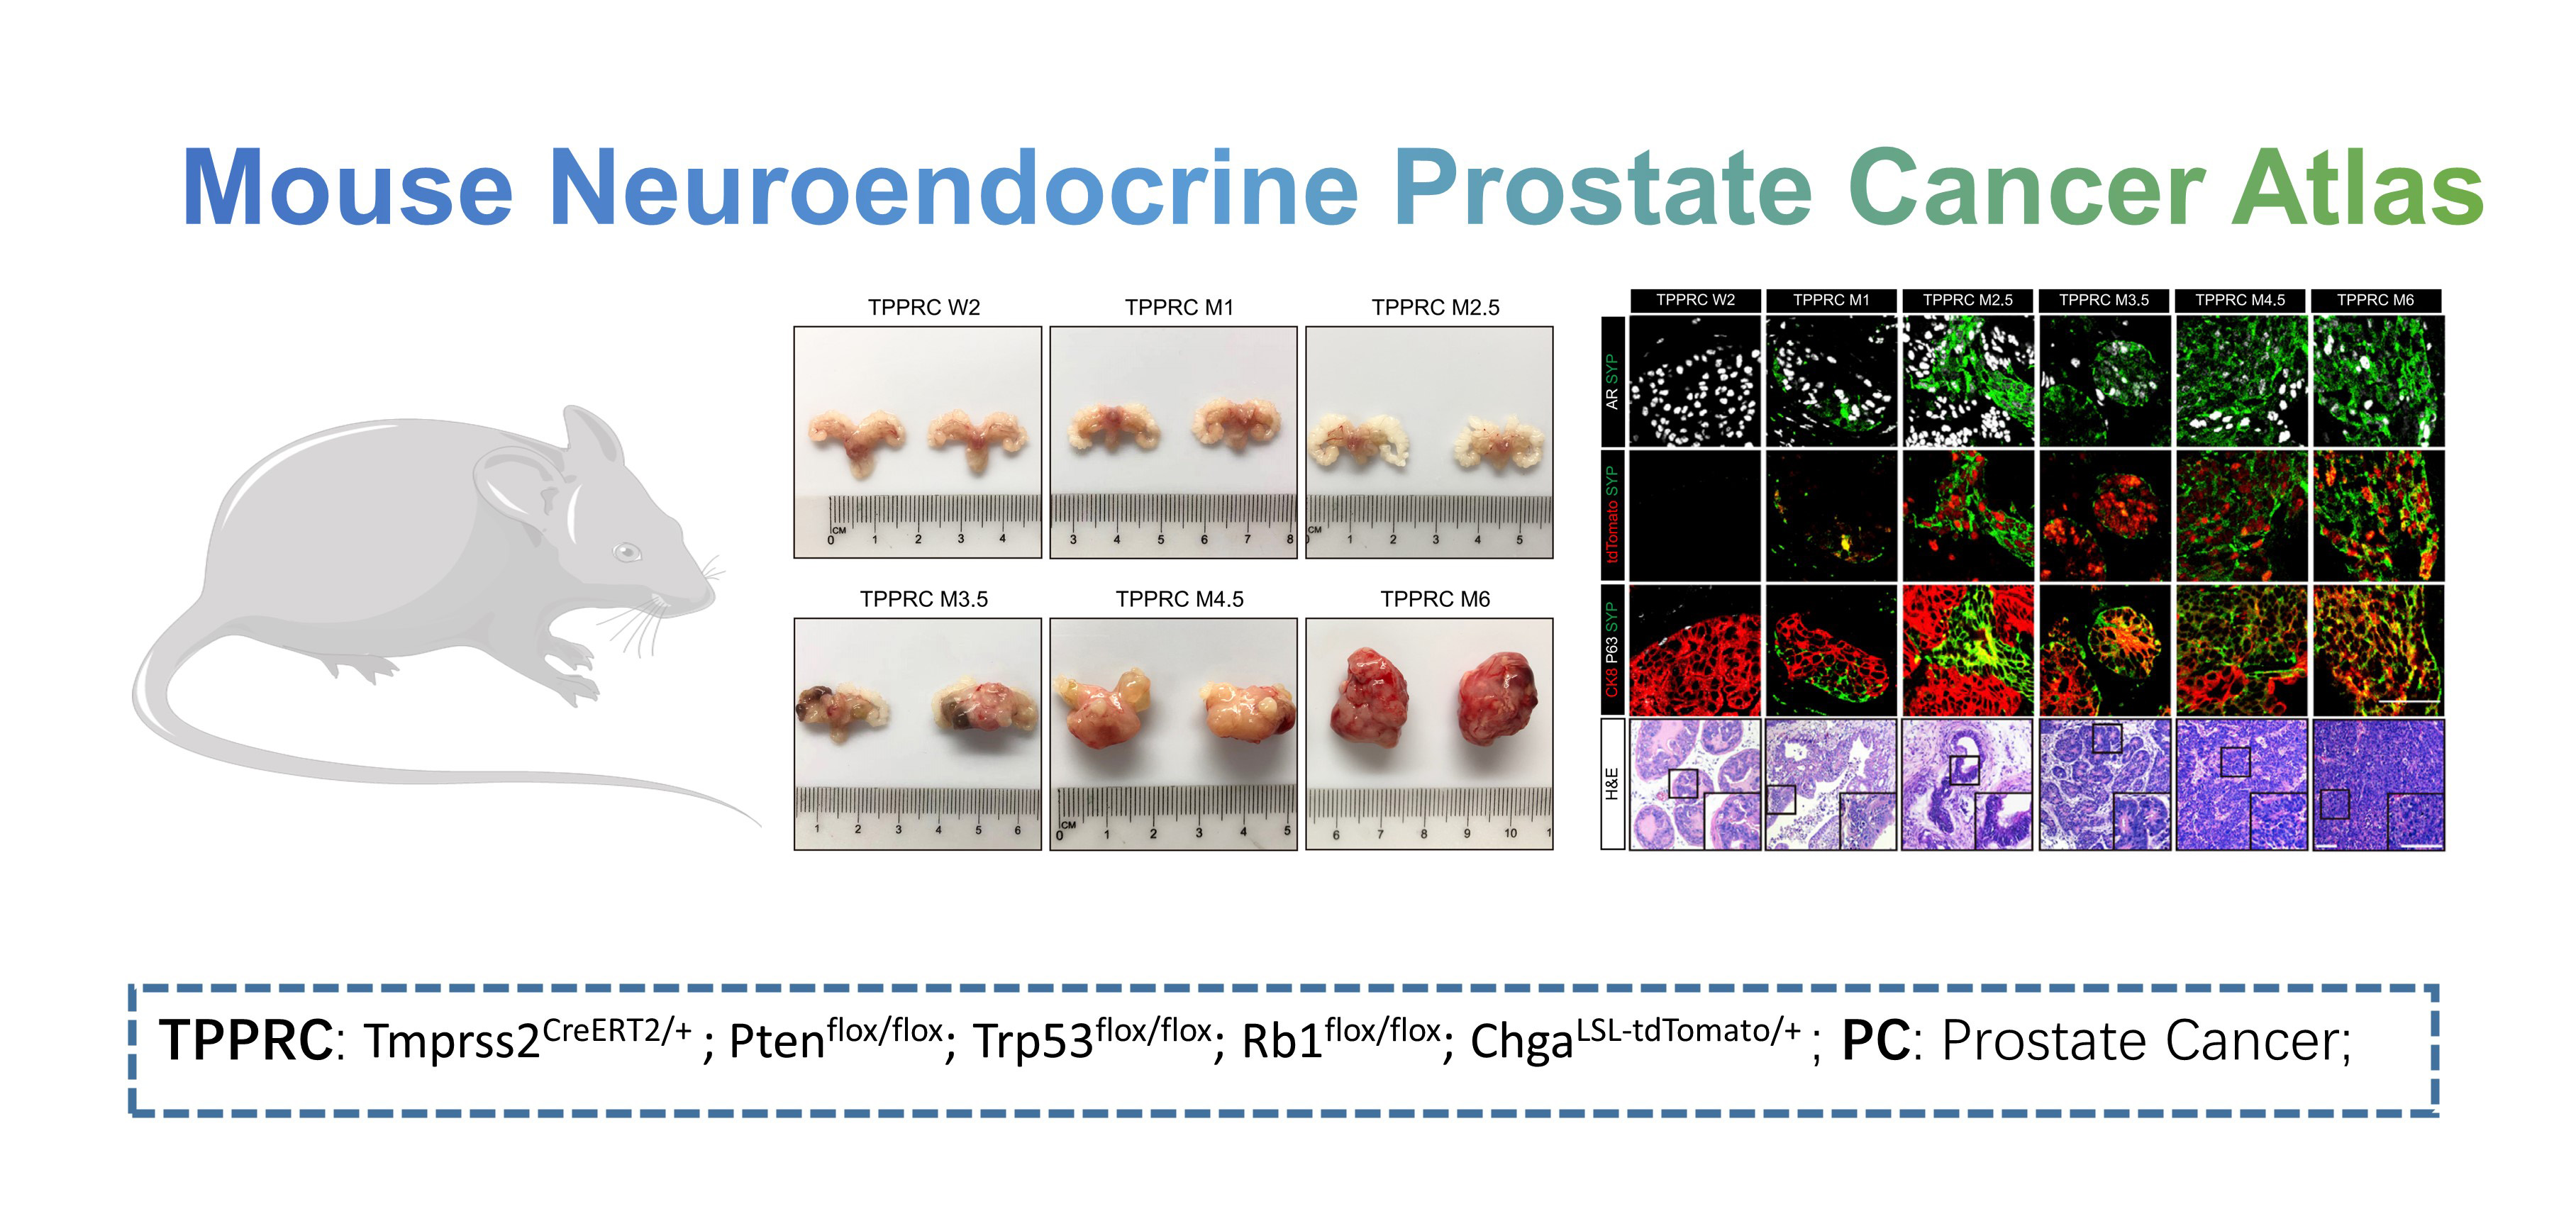
  • Mouse Neuroendocrine Prostate Cancer Atlas: this dataset contains normal mice prostate (n=2) and prostate tumors of TPPRC mice (n2 weeks=2, n1 month=2, n2.5 month=4, n3.5 month=2, n4.5 month=2, n6 month=1) in a time-series manner post tamoxifen administration. Data could be downloaded from OMIX001928 of NGDC data base.

stRNA datasets:

  • Human Corpus Cavernosum: The sample is a cross-section of the corpus cavernosum from a male with normal erectile function (but suffering from a penile tumor). Due to the chip size limitation, the data only includes the middle part of one side of the corpus cavernosum. Each spot has a diameter of 50 μm. The raw data can be downloaded from GSE261085 of GEO data base.

  • Rat Corpus Cavernosum: The sample is a cross-section of the corpus cavernosum from a health rat at 4 months old. Each spot has a diameter of 50 μm. The raw data can be downloaded from GSE261487 of GEO data base.

News


Version: 1.1

Atlas updated: 2023-08-12

  • Added a new dataset, the Mouse Neuroendocrine Prostate Cancer Atlas. This dataset was gotten from OMIX: OMIX001928.
  • Added a DMED sample to Human Corpus Cavernosum Atlas dataset so that it contains 3 biological repeats for normal, non-DMED and DMED, respectively.

Version: 1.2

Atlas updated: 2024-02-29

  • Added a new dataset, the Rat Corpus Cavernosum Atlas. This dataset was gotten from GEO: GSE259299.
  • Added a new webpage to show the spatial transcriptome data, we provide cell spatial distribution and gene expression spatial pattern plots.

Version: 2.0

Atlas updated: 2024-07-05

  • Welcome to the all-new MHA. In this update, we have included stRNA data, featuring two datasets: Human Corpus Cavernosum and Rat Corpus Cavernosum, which are now available on the SPATIAL page. Feel free to explore. The previous scRNA datasets have been moved to the SINGLE-CELL page. If you would like to suggest any datasets for inclusion in MHA, please contact Dr. Zhao.

Cite


Zhao L, Zhao Y, Yao CC, Dai YB, Li Z, Tang YX.MHA, an interactive website for scRNA-seq data of male genitourinary development and disease. Andrology. 2023;1-6. https://doi.org/10.1111/andr.13402

Funding


MHA is funded by the National Natural Science Foundation of China (82201756, LiangYu Zhao; and 82071636, YuXin Tang), National Key R&D Program of China (2022YFC2702700, Zheng Li), China Postdoctoral Science Foundation (2021M703747, LiangYu Zhao), GuangDong Basic and Applied Basic Research Foundation (2021A1515111109, LiangYu Zhao).

实验设计 Experiment Design

Loading...

聚类分群 Dimensional Reduction Plot

Color palettes

Loading...
Loading...

基因展示 Gene Expression Information
(注:输入基因前请先删除文本框内容。Hint: The user should delete the "Choose" in the drop-down menu before inputting.)

Loading...

气泡图 Dot Plot

Loading...

染色图片 Staining Image

Loading...

基因展示 Gene Expression Information
(注:输入基因前请先删除文本框内容。Hint: The user should delete the "Choose" in the drop-down menu before inputting.)

Loading...

MHA Instruction for Use (English)

1. Main Contents of MHA

01_MainContents

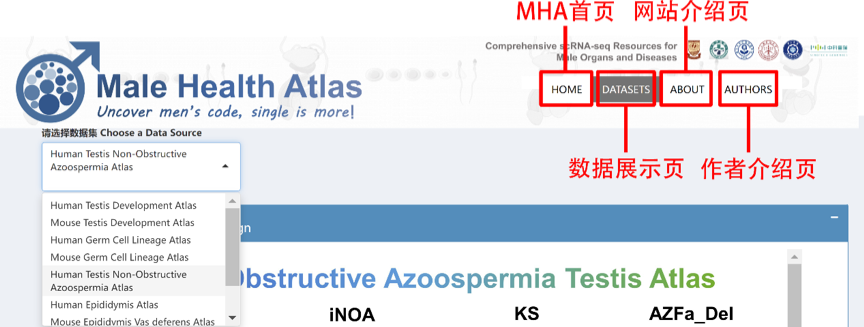
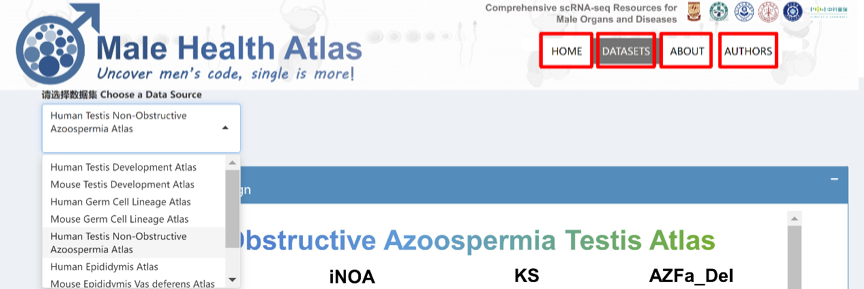
  • HOME: Introduction of the MHA database, updates, and references.
  • DATASETS: Functional page of the MHA, where users can select data sets to be displayed visually.
  • ABOUT: Help and manual for using MHA.
  • AUTHORS: Information on the authors of the MHA.

2. Dataset Selection

  • l In the DATASETS page, user can select an interesting dataset and wait 5-20 seconds for data loading (depending on the size of the dataset).
  • l When a dataset is loaded, a schema diagram (Experiment Design), its associated disease (or physiological processes) and cell naming abbreviations can be seen.

02_DataSelection

3. Dimensional Reduction Plot

03_DimensionalReduction

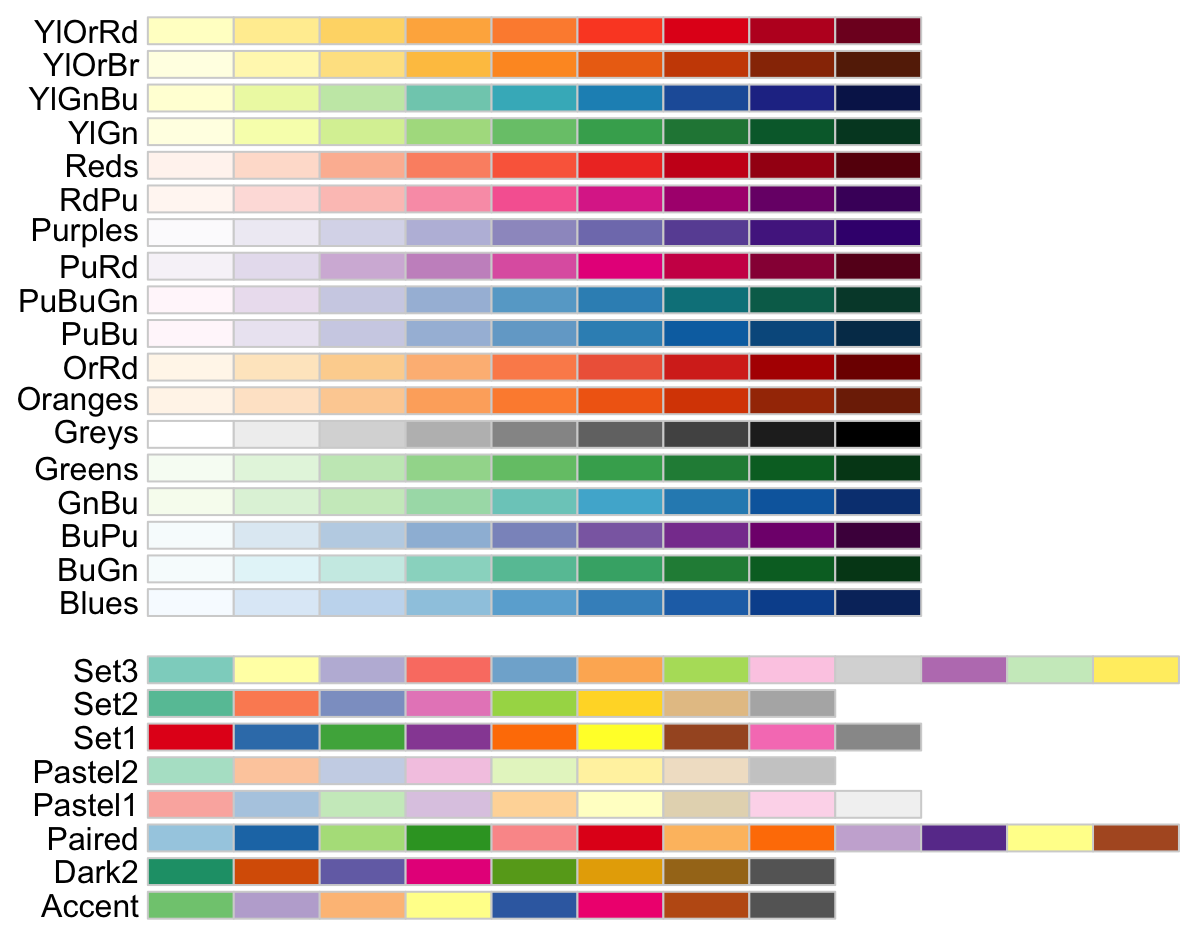
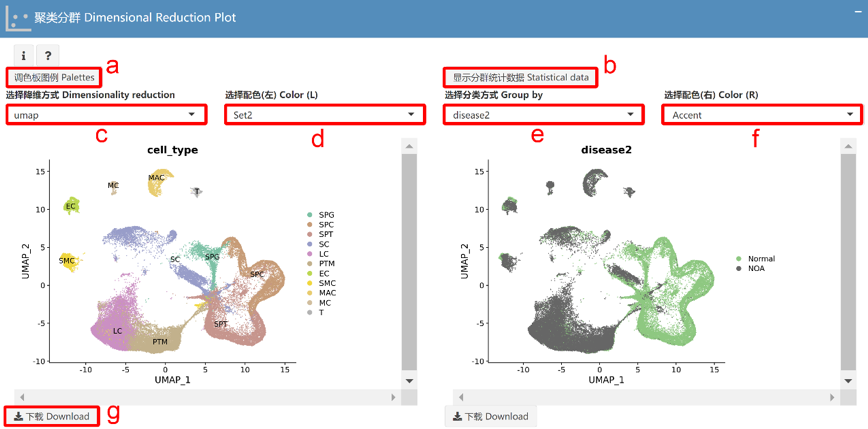
  • Dimensional Reduction Plot. a: show all palettes which can be selected. b: show the ratio of each cell cluster. c: tSNE or umap dimensional reduction can be selected, and the cells (dots) are labeled according to their “cell_type” information for mapping (left panel). d: select the palette for the left panel. e: select the cell grouping method of the right panel, such as cell type, sample source or disease type, etc. f: Select the palette for the right panel. g: click to download the output image result (higher resolution), it can also be saved by “right-click” and “save as” (lower resolution).

4. Single Gene Expression Information
​ In this section, we provide two output methods including cell dimension reduction plot and violin plot, and users can choose the grouping method and palette of cells by themselves.

04_SingleGeneExp1

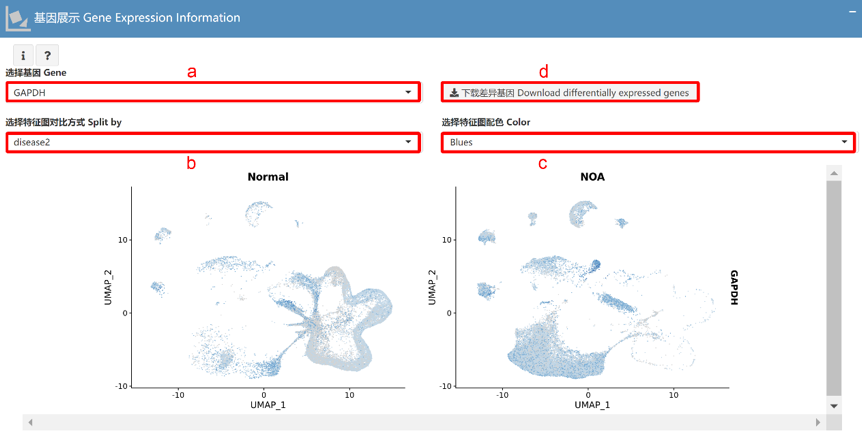
  • Single gene expression with dimensional reduction plot. a: Manually input or select the target gene. b: Select the cell grouping method of dimensional reduction plot, such as cell type, sample source or disease type, etc. All cells in this dataset will be displayed in one plot if select NULL. c: Select the color scale bar representing the level of gene expression. d: Click to download the different expression genes list between groups of this dataset.

04_SingleGeneExp2

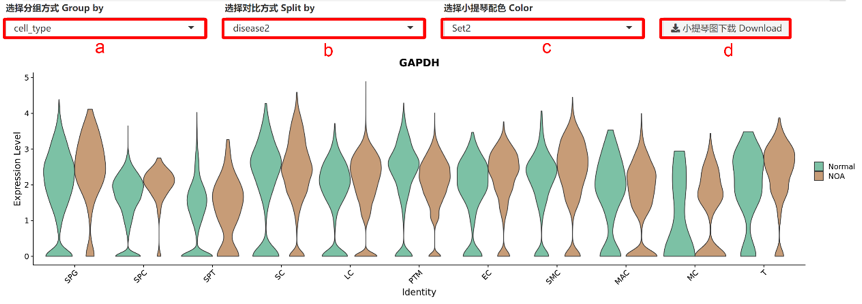
  • Violin plot of one single gene expression. a: select the cell grouping method of the violin plot (X-axis), generally, only the default grouping method of “cell_type” is provided; b: select the group comparison method of violin plot (each column split by what), including sample source or disease type, etc. c: select the color scheme of different split groups within one cell type; d: click to download the PDF file results.

  • Note: When the percentage of positive cell of target genes was very low, the width of the violin plot column often reducing to a line, so it was more suitable to choose a dimensional reduction plot or dot plot to display.

5. Multiple Gene Expression Information
​ In order to display the information of multiple genes, we also provide the output method of dot plot.

05_MultipleGeneExp

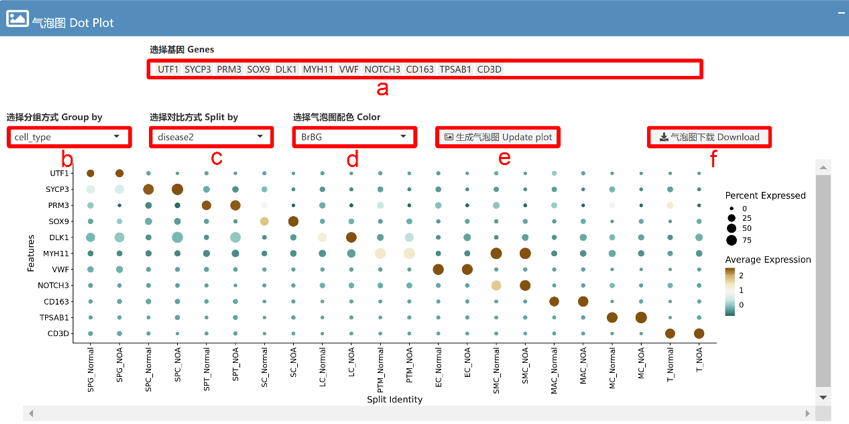
  • Dot plot. a: users can manually input or select multiple genes to be displayed. b: select the cell grouping method of dot plot. c: Select the group comparison method of dot plot, including sample source or disease types, etc. (the X axis group is named as “Group by _ Split by”). d: select the color scale bar of the gene expression level; e: click to generate dot plot. f: click to download the result PDF file.

6. FAQ

6.1 I could not find the page titles (HOME DATASETS ABOUT AUTHORS) in the home page.

061_NavBar

Solution: The user can re-display the hidden page titles by Setting -ZOOM in the browser. In addition, some mobile phones directly open the website in WeChat may also cause the above problems, can be solved by opening in the browser.

6.2 I could not input gene name in drop-down menu of the “Single gene expression information” section.

062_Input

Solution: The user should delete the “Choose” in the drop-down menu before inputting.

7. Others

​ For more help and information about MHA, please contact author via zlyinwangyi@163.com.

MHA 数据库使用说明(中文)

1. 网站说明

01_MainContents

  • MHA首页:用于展示MHA数据库的简单介绍、更新和相关的引用信息。
  • 数据展示页:MHA的主要内容,用户可在本栏选择数据集进行可视化展示。
  • 网站介绍页:帮助与介绍信息。
  • 作者介绍页:MHA网站的主要建设参与者信息。

2. 数据选择

  • 在数据展示页(DATASETS),选择相应的数据集,等待5~20秒数据加载(时间根据数据集大小变化)。
  • 数据集加载后,可看见该数据集的模式图、相关疾病(或生理发育过程)与细胞命名缩写规则。

02_DataSelection

3. 单细胞聚类与降维散点图

03_DimensionalReduction

  • 细胞聚类与降维散点图a: 展示所有可供选择的配色方案;b:计算并显示各细胞群所占比例;c:可选择tSNE或者umap两种降维方式,作图使用默认细胞分组;d:选择左侧散点图的配色; e:选择右侧散点图的细胞分组方式,包括细胞类型、样本来源或疾病分组等;f:选择右侧散点图的配色;g:点击可下载输出的图片结果(分辨率较高),该结果同样可使用右键-另存为方式保存(分辨率较低)。

4. 单基因展示

​ 在此部分,每次可展示一个基因的表达特征信息。我们提供细胞降维散点图小提琴图两种结果输出方式,用户可自行选择细胞的分组方式和配色方案等。

04_SingleGeneExp1

  • 单基因表达散点图a:手动输入或选择目标基因;b:选择散点图的细胞分组方式,包括细胞类型、样本来源或疾病分组等,NULL代表默认不进行分组展示所有细胞;c:选择代表基因表达高低的配色方案;d:点击下载本数据集各类细胞或者各组间差异基因。

04_SingleGeneExp2

  • 单基因表达小提琴图a:选择小提琴图的细胞分组方式(X轴),一般只提供细胞类型的默认分组;b:选择小提琴图的同组对比方式,包括样本来源或疾病分组等;c:选择同细胞类型不同对比组的配色方案;d:点击下载小提琴图结果PDF文件。

  • 注:当组的目标基因阳性表达占比较低时,小提琴图宽度缩小为一条线,此时可选用细胞降维散点图或者气泡图展示更为合理。

5. 多基因展示

​ 为了方便展示多个基因的信息,我们在此部分提供了气泡图的结果输出方式。

05_MultipleGeneExp

  • 基因表达气泡图a:用户可以手动输入或选择多个待展示基因。b:选择气泡图的细胞分组方式,一般只提供细胞类型的默认分组;c:选择气泡图的同组对比方式,包括样本来源或疾病分组等(X轴各组名称以“分组方式_对比方式”命名);d:选择代表基因表达高低的配色方案;e:点击生成气泡图;f:点击下载结果文件。

6. 常见问题

6.1 在首页中看不见各个分页标签 (HOME DATASETS ABOUT AUTHORS)

061_NavBar

解决方法:用户可以调整浏览器设置-缩放显示分页标题。另外,部分手机在微信中直接打开本网站也可能出现上述问题,可以通过在浏览器中打开解决。

6.2 在单基因展示部分,无法在下拉菜单中输入基因名

062_Input

解决方法:下拉菜单中默认基因名为“Choose”,用户需要先删除下拉菜单中内容后,才可以输入新内容。

7. 其他

​ 其他问题或者建议,欢迎通过邮箱zlyinwangyi@163.com联系作者。


Liangyu Zhao M.D, PH.D.

  • Clinical Medicine Bachelor, School of Medicine, Shanghai Jiao Tong University

  • Master of Surgery, Shanghai general hospital, Shanghai Jiao Tong University

  • Doctor of Surgery, Shanghai general hospital, Shanghai Jiao Tong University

  • Postdoctoral Fellow (Clinical), Department of Urology, the Fifth Affiliated Hospital Sun Yat-Sen University

Dr. Zhao is mainly engaged in basic and clinical research related to spermatogenesis disorder and male infertility. In the past five years, he has published 8 SCI papers and 2 CSSCI papers as the first author. Own 3 national patents and presided over 1 university-level project. Award during the university: “Merit Student” of Shanghai Jiao Tong University, “Outstanding Graduate” of Shanghai Jiao Tong University, “Academician Charity Scholarship” of Red Cross Foundation of China.

Major publications:

  • Single-cell transcriptome atlas of the human corpus cavernosum. Nat Commun. 2022 Jul 25;13(1):4302. doi: 10.1038/s41467-022-31950-9.

  • Single-cell analysis of developing and azoospermia human testicles reveals central role of Sertoli cells. Nat Commun. 2020 Nov 10;11(1):5683.

  • Bi-allelic SHOC1 loss-of-function mutations cause meiotic arrest and non-obstructive azoospermia. J Med Genet. 2020 Sep 8:jmedgenet-2020-107042.

  • Intra-Seminiferous Tubular Injection of Vascular Endothelial Growth Factor C Sustained-Release Ultrafine Particles: A Novel Method for Improving the Regeneration of Spermatogenesis After Chemotherapy. J Biomed Nanotechnol. 2019 Dec 1;15(12):2376-2392.

  • VEGFC/VEGFR3 Signaling Regulates Mouse Spermatogonial Cell Proliferation via the Activation of AKT/MAPK and Cyclin D1 Pathway and Mediates the Apoptosis by affecting Caspase 3/9 and Bcl-2. Cell Cycle. 2018;17(2):225-239.

Contact us:

Zheng Li, Professor

  • Deputy Director of Urology Center, Director of Andrology Department, Deputy Director of Assisted Reproduction Department, Shanghai general hospital.

  • Chief physician, professor, doctoral supervisor.

  • Standing Member and Director General of Andrology and Sexual Medicine Branch of Chinese Medical Doctor Association (CMDA).

  • Former Chairman of Andrology Branch of Shanghai Medical Association.

  • Member of the Standing Committee of Reproductive Medicine Professional Committee of Chinese Medical Doctor Association and Deputy Leader of Andrology.

  • Standing Member and Secretary General of Asian Andrology Association.

  • Vice President of Reproductive Physicians Branch of Shanghai Medical Doctor Association.

Professor Li is focusing on the mechanism of spermatogenesis and the induction of sperm differentiation from stem cells, spermatogonial stem cells have been obtained from patients' testicles for the first time in the world, and can be induced to differentiate into sperm cells in vitro with fertilization potential. As the first prize-winner, he has won the Second Prize of Science and Technology Progress Award of the Ministry of Education, the First Prize of Shanghai Medical Science and Technology, the Outstanding Academic Contribution Award of Asian Andrology Association, the Leading Personality Award of Shanghai Medical Association, and the Outstanding Teacher Award of School of Medicine of Shanghai Jiao Tong University.

Yuxin Tang, Professor

Professor Tang graduated from Xiangya Medical College of Central South University in 1993 and received his doctor degree in surgery from Central South University in 2010. Currently, he is deputy director of urology Department of the Fifth Affiliated Hospital of Sun Yat-sen University, director of male specialty, deputy director of teaching and Research Department of Surgery, professor, chief physician, and doctoral supervisor. He is now a member of andrology and Sexual Medicine Branch of Chinese Medical Association, a member of andrology Professional Committee of Chinese Medical Association, and chairman of Andrology Branch of Zhuhai Medical Association.

Yifan Zhao, Bioinformatician

  • Bachelor of Science, Bioinformatics and Computational Biology, Worcester Polytechnic Institute
  • Master of Science, Bioinformatics and Computational Biology, Worcester Polytechnic Institute
  • Bioinformatician, Sinotech Genomics, Inc.

Yifan is the main finisher of Male Health Atlas database website construction and deployment. She have received complete training on bioinformatics and structural biology research techniques during school. Now, she is in charge of single-cell transcriptomic analysis at her company. She has a great interest in visualizing data in R and constructing websites using shiny package. In the future, she hopes to learn more about the statistical methods and algorithms behind the bioinformatics analysis and become an independent researcher.

Individual website:


赵亮宇 博士

  • 上海交通大学医学院 临床医学 本科
  • 上海交通大学附属第一人民医院 外科学 硕士
  • 上海交通大学附属第一人民医院 外科学 博士
  • 中山大学附属第五医院 泌尿外科 博士后(临床型)

主要从事精子发生障碍与男性不育相关基础和临床研究,近五年以第一作者发表SCI论文8篇,中文核心期刊2篇,第一发明人获批国家专利3项,主持/参与国家级/省级项目多项。在校期间获得上海交通大学“三好学生”,上海交通大学“优秀毕业生”,中国红十字基金会“院士博爱奖学金”等多项荣誉。

代表作:

  • Single-cell transcriptome atlas of the human corpus cavernosum. Nat Commun. 2022 Jul 25;13(1):4302. doi: 10.1038/s41467-022-31950-9.
  • Single-cell analysis of developing and azoospermia human testicles reveals central role of Sertoli cells. Nat Commun. 2020 Nov 10;11(1):5683.
  • Bi-allelic SHOC1 loss-of-function mutations cause meiotic arrest and non-obstructive azoospermia. J Med Genet. 2020 Sep 8:jmedgenet-2020-107042.
  • Intra-Seminiferous Tubular Injection of Vascular Endothelial Growth Factor C Sustained-Release Ultrafine Particles: A Novel Method for Improving the Regeneration of Spermatogenesis After Chemotherapy. J Biomed Nanotechnol. 2019 Dec 1;15(12):2376-2392.
  • VEGFC/VEGFR3 Signaling Regulates Mouse Spermatogonial Cell Proliferation via the Activation of AKT/MAPK and Cyclin D1 Pathway and Mediates the Apoptosis by affecting Caspase 3/9 and Bcl-2. Cell Cycle. 2018;17(2):225-239.

联系方式:

李铮 教授

  • 上海交通大学附属第一人民医院泌尿中心副主任、男科主任、辅助生殖科副主任

  • 主任医师、教授、博导

  • 中国医师协会男科与性医学分会常委兼总干事

  • 上海医学会男科学分会前任主任委员

  • 中国医师协会生殖医学专业委员会常委兼男科学副组长

  • 亚洲男科学协会常委兼秘书长

  • 上海医师协会生殖医师分会副会长

近年来聚焦精子发生机制与干细胞向精子诱导分化研究,国际上首次实现从患者睾丸中获取精原干细胞,体外诱导分化为精子细胞,并具有受精潜能。作为第一完成人,荣获教育部科技进步二等奖,上海医学科技一等奖,亚洲男科学协会“杰出学术贡献奖”,上海医学会 “领军人物奖”,上海交通大学医学院 “卓越教师奖”。

汤育新 教授

  1993年毕业于中南大学湘雅医学院,2010年获中南大学外科学博士学位。现任中山大学附属第五医院泌尿外科副主任,男性专科主任、外科教研室副主任,教授、主任医师、博士研究生导师。现为中国医师协会男科与性医学医师分会委员,中华医学会男科学专业委员会委员,珠海市医学会男科分会主任委员。

  主持国家自然科学基金面上项目3项,主持省部级科研5项,以第一作者或通讯作者发表的论文50余篇,其中SCI 30余篇,获省部级成果三项。

赵艺凡 信息工程师

  • 伍斯特理工学院 生物信息学 本科
  • 伍斯特理工学院 生物信息学 硕士
  • 上海鲸舟基因科技有限公司 生物信息工程师

Male Health Atlas 数据库网站搭建及部署工作的主要完成人。在校期间接受了完善的生物信息学与结构生物学研究技术的培训,擅长单细胞转录组分析,数据可视化、shiny网站搭建及部署相关工作。希望将来可以更深入了解生物学背后的统计及算法概念,成为独立研究者。

个人主页: